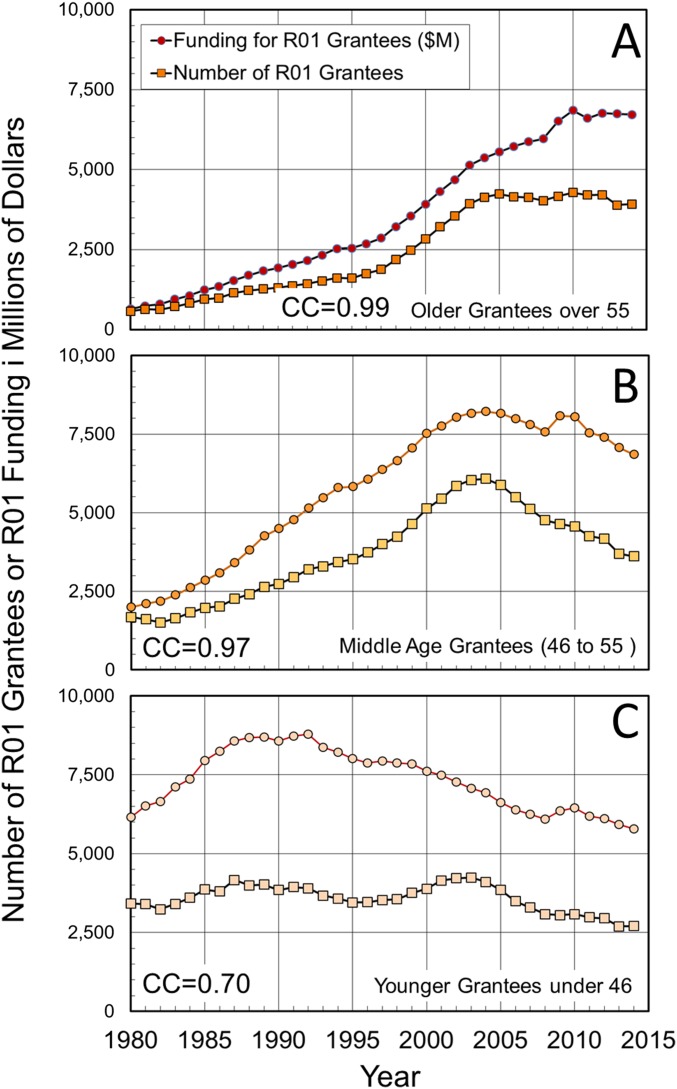
Fig. S4.
This figure shows the relationship between the funds allocated to R01 grantees and the number of R01 grantees. These two datasets would be perfectly correlated if all grantees in a particular age group received the same allocation in BRDPI inflation-corrected dollars for each of the years from 1980 to 2014. The Inset correlation coefficient (CC) is that between R01 funding (squares) and number of R01 grantees (circles) in each of the three age ranges. Because grantees get grants that are close to 1 M$, the same x axis can be used for both numbers of R01 grantees and funding in million dollars. A shows the data of older grantees. B shows the data of middle-aged grantees. C shows the data of younger grantees.

