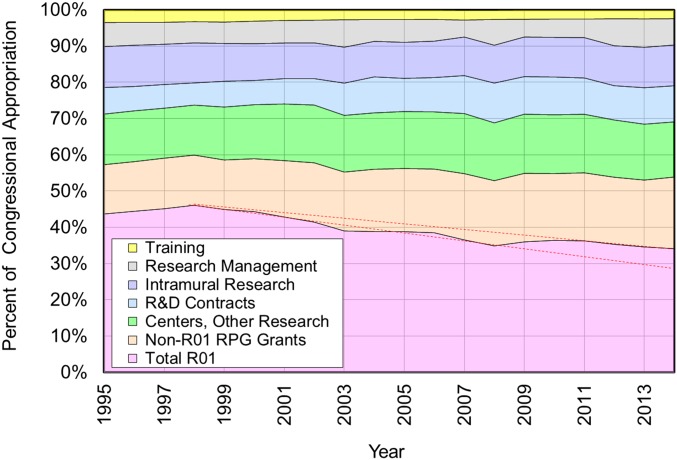
Fig. S7.
This figure shows how NIH budget line items expressed as a percentage of the total appropriation have changed between 1995 and 2014. Seven items are considered in the legend; they constitute the entire congressional appropriation, so their total is always 100%. The same data are used in Table S1. Here, we see that the percentage of the allocation for R01 grants dropped sharply from a high of 46% in 1998 to a low of 34% in 2014. This occurred as other non-R01 grant programs were ramped up to absorb the huge increase in congressional appropriation that occurred from 1999 to 2004. The red dashed lines show that, in 2008, the allocation percentage for R01 grants was increased as competition for dwindling R01 funds became intense. Had this not happened, the percentage allocation for R01 grants in 2014 would have been 5% lower at 29%.

