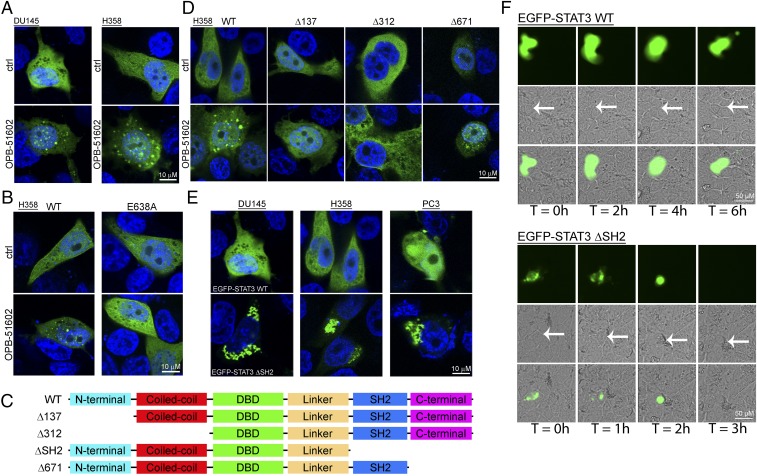
Fig. 4.
Induction of STAT3 protein aggregates by OPB-51602. (A) Distribution of EGFP-STAT3 (green) in DU145 and H358 cells untreated or treated with OPB-51602 for 6 h in CM. Nuclei were stained with DAPI (blue). (B) Effect of OPB-51602 on WT and mutated (E638A) EGFP-STAT3. (C and D) WT and truncated variants of EGFP-STAT3 (C) and differential responses to treatment with OPB-51602 (D). (E) Spontaneous aggregation of ΔSH2 EGFP-STAT3 variant in CM cultures. (F) Live fluorescence, phase contrast, and composite images of H358 cells expressing WT or ΔSH2 EGFP-STAT3 at the indicated time points. Arrows indicate the position of EGFP+ cells in phase contrast images.

