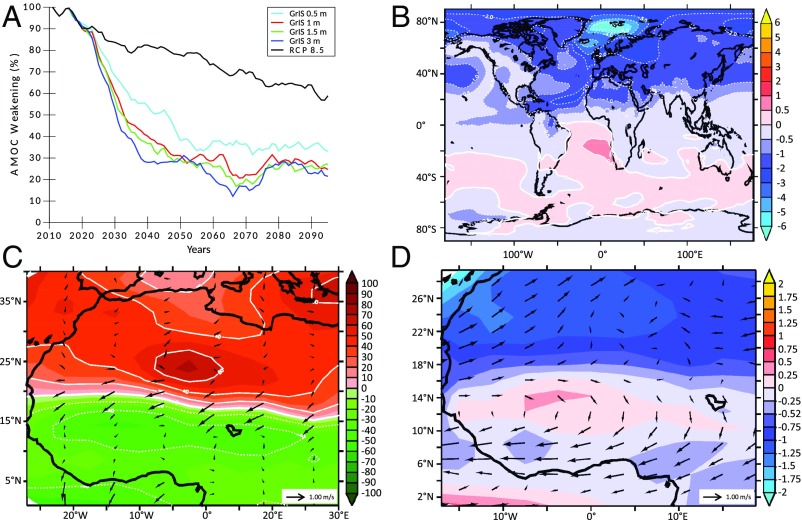
Fig. 1.
Teleconnection mechanisms linking the Greenland ice sheet melting and the decrease of the Sahelian rainfall. (A) AMOC evolution (in percent with respect to the present-day values). (B) Mean annual temperature anomaly between the 1.5-m GrIS and the RCP8.5 scenarios averaged over the period 2030–2060. (C) Same as B but for the sea level pressure anomaly, and the 10-m winds (black arrows). (D) Same as B but for the mean summer (JJAS) temperature anomaly and the 850-hPa winds (black arrows).

