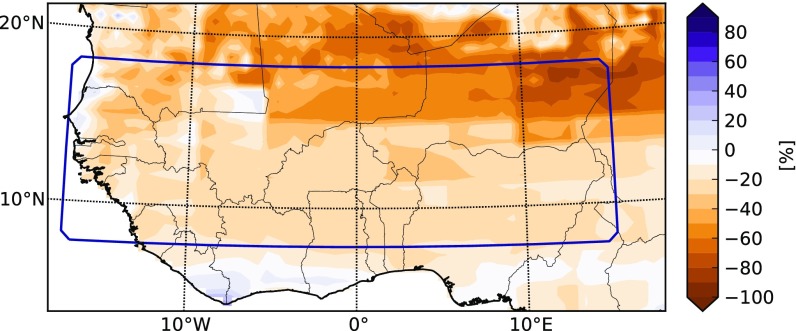
Fig. 2.
JJAS precipitation anomaly between the 1.5-m GrIS scenario and the RCP8.5 baseline experiment normalized to the RCP8.5 values and averaged over 2030–2060. A value of 100 corresponds to a doubling of precipitation, and −100 corresponds to zero precipitation. The precipitation values are obtained after applying the statistical method (Methods). The blue box (8°N to 18°N, 17°W to 15°E) represents the region under study.

