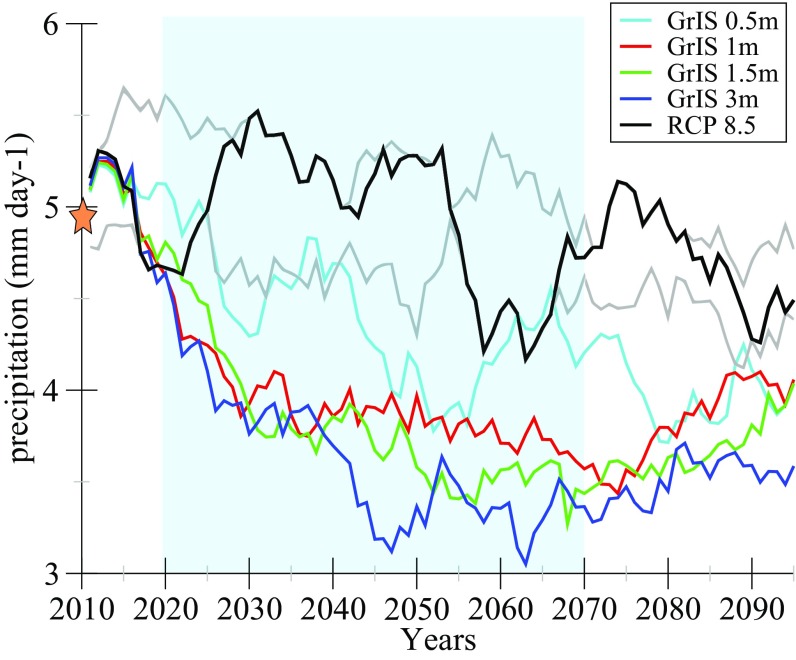
Fig. 3.
Evolution of JJAS precipitation during the 21st century averaged over the Sahel area (8°N to 18°N, 17°W to 15°E) for the RCP8.5 and the GrIS scenarios. The orange star indicates the simulated JJAS precipitation over the climatic reference period (1976–2005) deduced from the IPSL-CM5A simulated precipitation (4.96 mm). To illustrate the internal model variability, we considered a four-member dataset of the RCP8.5 scenario, each member differing in initial conditions. The area delimited by the two gray curves represents the range of model variability deduced from the four-member dataset.

