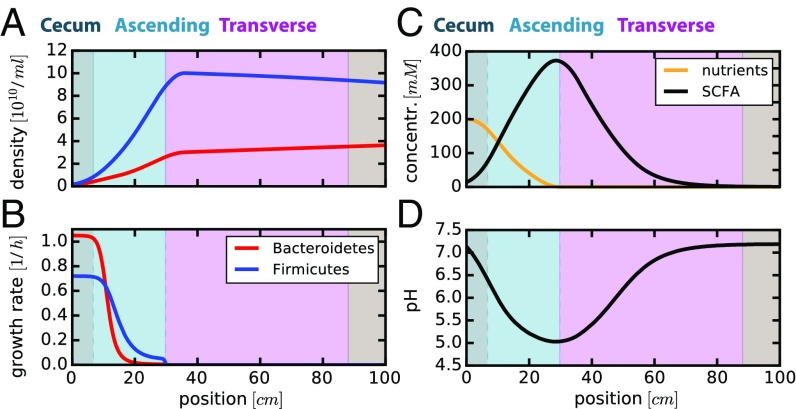
Fig. 3.
Spatial profiles along the colon predicted for standard Western diet. Results of the model with a nutrient influx of 300 mmol glucose equivalents per day entering the colon. Spatial profiles for different variables are plotted: (A) local densities and (B) growth rates of Bacteroidetes (red) and Firmicutes (blue); (C) local nutrient (orange) and total SCFA (black) concentrations; (D) local pH values. The background colors correspond to the different sections of the colon as illustrated in Fig. 2A. Only the first 100 cm of the colon are shown here, as all observables remain effectively unchanged further downstream. Parameters are given in SI Appendix, Tables S1 and S2. Results shown here are for simulations after 120 h. Temporal dynamics along the length of the colon is shown in SI Appendix, Fig. S3, for recovery from a low initial bacterial density profile.

