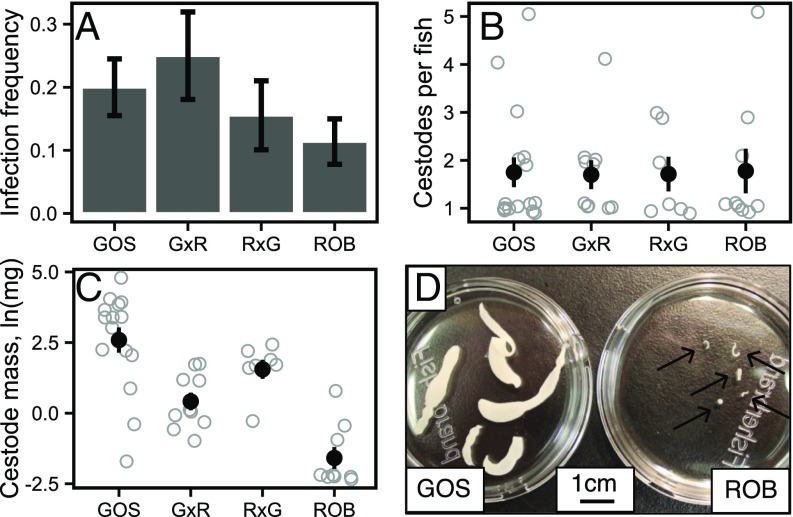
Fig. 3.
Infection success as measured by (A) infection frequency (the proportion of stickleback with S. solidus), (B) mean abundance of S. solidus per fish, and (C) log-transformed cestode mass (averaged across all cestodes in each fish). Error bars indicate SEs. (D) Full-sibling cestodes removed from GOS and ROB stickleback 42 d postexposure. Fig. S7 presents cestode masses from marine genotypes and F1 crosses between marine fish and GOS or ROB fish. Number of experimental fish per population in A: GOS, 80; G×R, 40; R×G, 45; ROB, 79. The number of infected fish per population is noted in Fig. 2.

