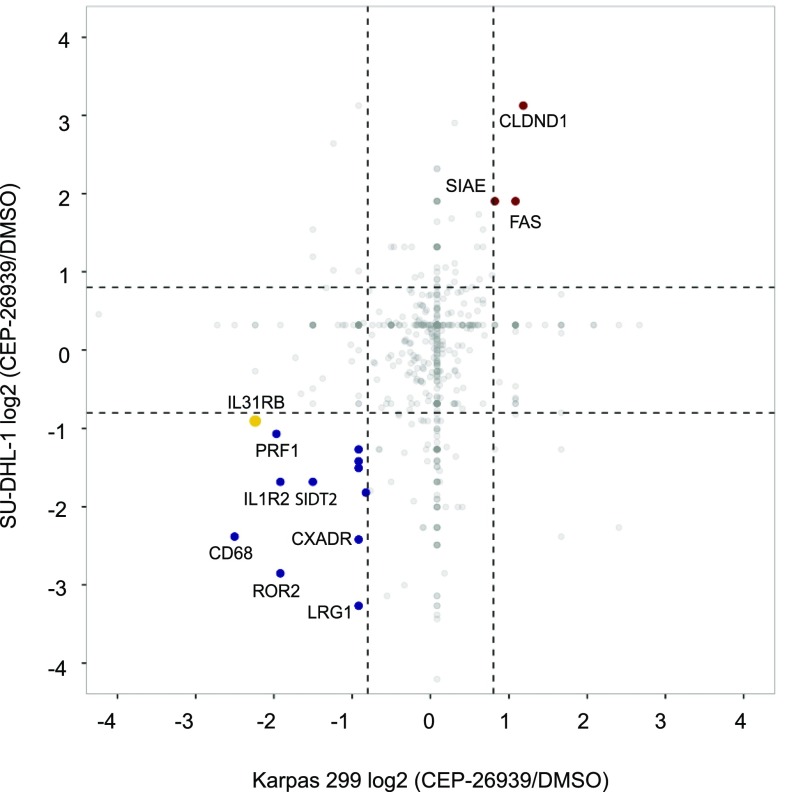
Fig. S5.
N-glycoproteomic profiling results of ALK+ALCL cell lines treated with an ALKi. Results of the differential N-glycoproteomic profile analysis of SU-DHL-1 and Karpas 299 cell lines treated with CEP-26939 (300 nM) or DMSO. The x axis represents the log2-transformed ratio for the Karpas 299 line, and the y axis represents the log2-transformed ratio for SU-DHL-1 line. N-glycoproteins whose expressions are 1.5-fold decreased in CEP-26939 compared with DMSO in both cell lines are indicated with blue dots. N-glycoproteins whose expressions are 1.5-fold increased in CEP-26939–treated cells compared with DMSO-treated cells in both cell lines are indicated with red dots. Dashed lines mark the enrichment boundaries.

