Fig. 5.
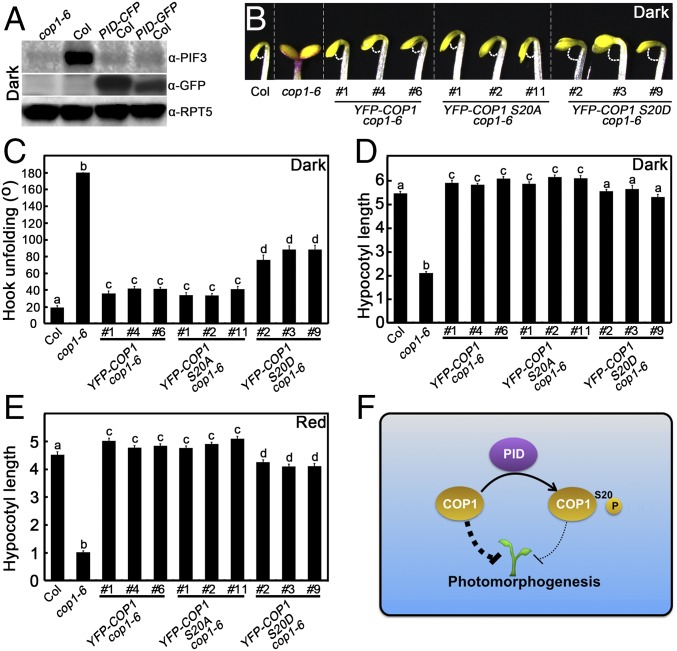
Phenotypic analysis of YFP-COP1 S20A cop1-6 and YFP-COP1 S20D cop1-6 transgenic seedlings. (A) PIF3 and PID protein levels in cop1-6, Col, PID-CFP Col, and PID-GFP Col seedlings grown in darkness as detected by PIF3 and GFP antibodies. Plant total proteins were extracted from 5-d-old seedlings grown in the dark. cop1-6 served as a negative control. RPT5 protein levels were used as loading controls. (B–D) Hook phenotypes (B), unfolding angles (C), and hypocotyl lengths (D) of Col, cop1-6, YFP-COP1 cop1-6, YFP-COP1 S20A cop1-6, and YFP-COP1 S20D cop1-6 seedlings grown in darkness for 2 d. Error bars represent SE (n ≥ 20). (E) Hypocotyl lengths of Col, cop1-6, YFP-COP1 cop1-6, YFP-COP1 S20A cop1-6, and YFP-COP1 S20D cop1-6 plants grown in red light (58.7 μmol·m−2·s−1) for 4 d. Error bars represent SE (n ≥ 20). (F) A working model showing how PID mediates in maintaining appropriate COP1 activity. PID directly phosphorylates COP1 on Ser20 to repress its activity, which in turn serves to precisely control COP1 activity to ensure normal plant development. In B, C, and D, letters above the bars indicate significant differences (P < 0.05) as determined by one-way ANOVA with Tukey’s post hoc analysis.

