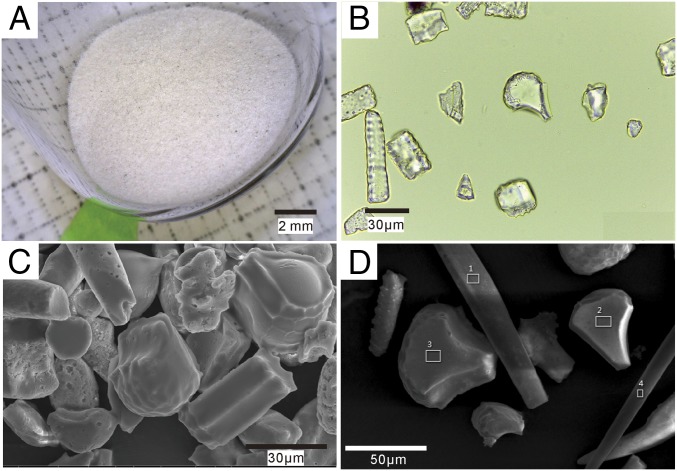
Fig. 2.
Images and EDS analysis of phytoliths extracted from cultural layers. (A) Images of phytoliths; (B) optical microscopy of phytoliths; (C) SEM images of phytoliths; and (D) EDS analysis of phytolith surface. (The white boxes are EDS spectra of phytoliths, which are shown in Fig. S2.)

