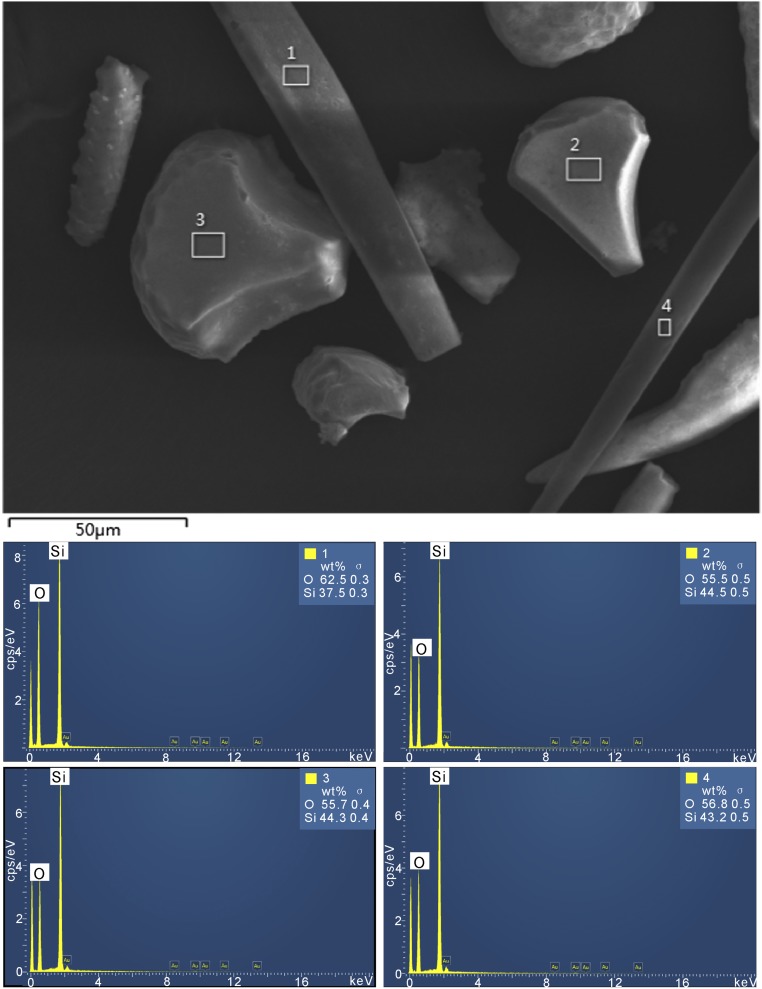
Fig. S2.
EDS analysis of phytolith surfaces. 1 and 4 are EDS spectra of elongate phytoliths; 2 and 3 are EDS spectra of bulliform phytoliths. EDS analysis results show that the predominant elements of the phytolith surfaces are silicon and oxygen, and weight percent ratios of Si and O vary between 0.6 and 0.8. No carbon was detected by the EDS spectra of the phytolith.

