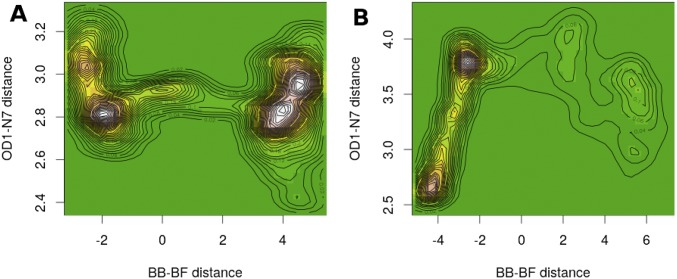
Fig. S4.
Projections of histogrammed densities of the structures along all reaction trajectories on the plane of the OD1(Asn243)–N7(guanosine) distance vs. the difference of bond-breaking (BB)–bond-forming (BF) distances for heavy F159Y (A) and light F159Y (B). The “terrain” color map (green for “plains”, i.e., zero density, up to white for “mountains”, i.e., maximum density of structures) represents the allocation of a pair of the above distances among structures along the reaction path. Contour maps that join points with equal density have also been drawn.

