
Figure 1.
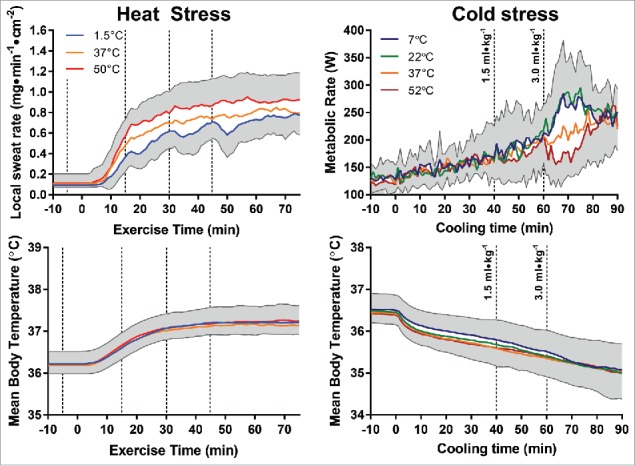
Redrawn thermometric (mean body temperature, bottom panels) and physiologic responses (sweat rate, top left panel; metabolic rate, top right panel) to warm and cold fluid ingestion during exercise in the heat from Morris et al. 20142 (left panels) and passive cold exposure from Morris et al. 20163 (right panels). Dashed lines denote time points at which fluid ingestion occurred.