. 2015 Mar 25;6(5):2806–2811. doi: 10.1039/c5sc00360a

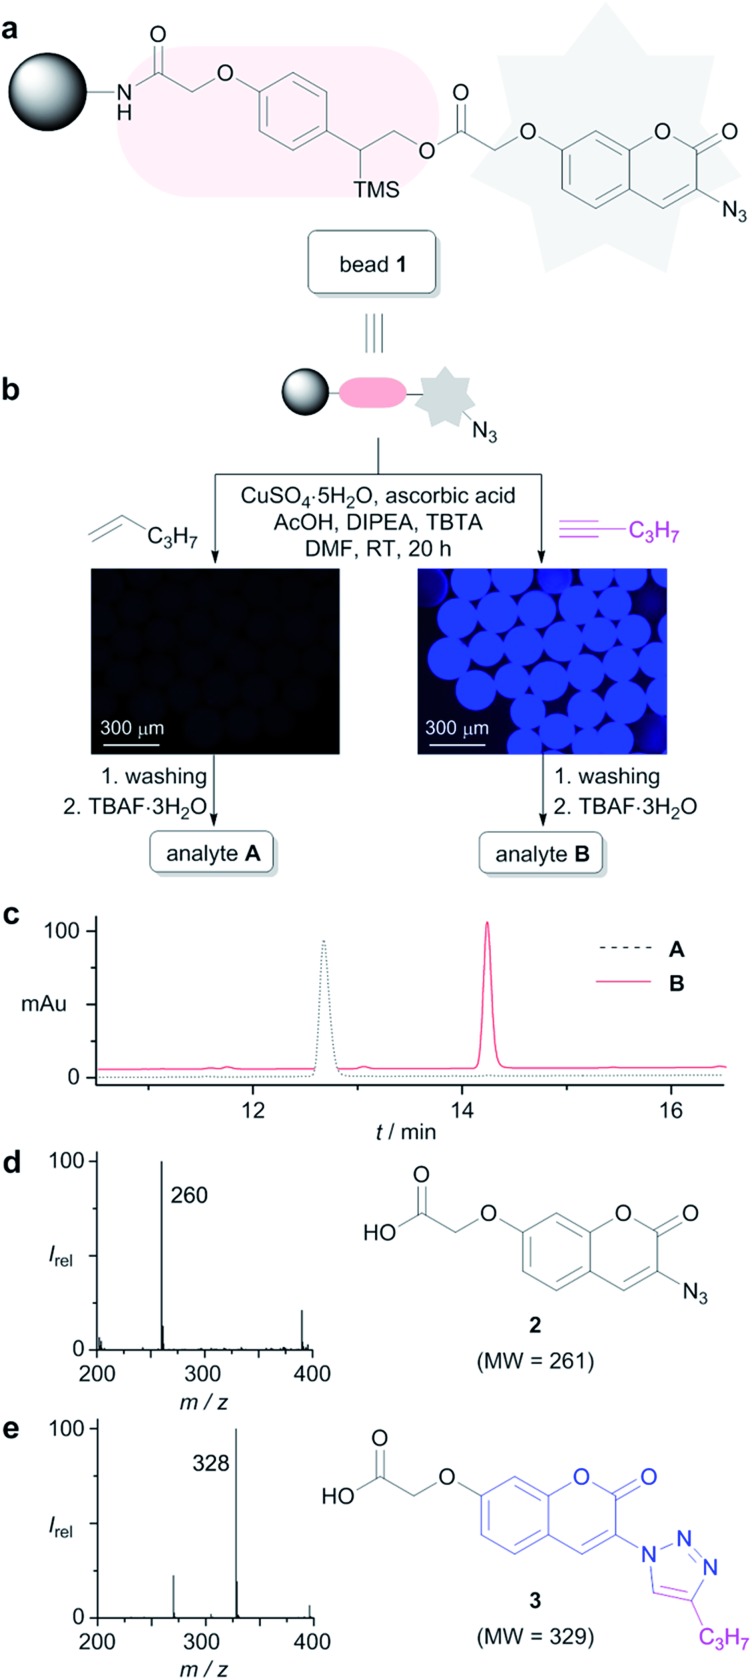
Fig. 2. Solid-supported alkyne sensing system. (a) The chemical structure of alkyne sensing bead 1; (b) schematic representation of the reaction procedure and fluorescence images of the beads (fluorescence images were obtained using excitation/emission filters of 387 nm/434 ± 9 nm and a 10× objective lens); (c) overlaid LC chromatograms of analytes A and B (at 345 nm); (d) ESI negative ionization mode mass spectrum of the peaks at 12.7 min for analyte A and the structure of 2; (e) ESI negative ionization mode mass spectrum of the peaks at 14.2 min for analyte B and the structure of 3. DIPEA = N,N-diisopropylethylamine; TBTA = tris[(1-benzyl-1H-1,2,3-triazol-4-yl)methyl]amine; MW = molecular weight.

Fig. 2