Fig. 9.

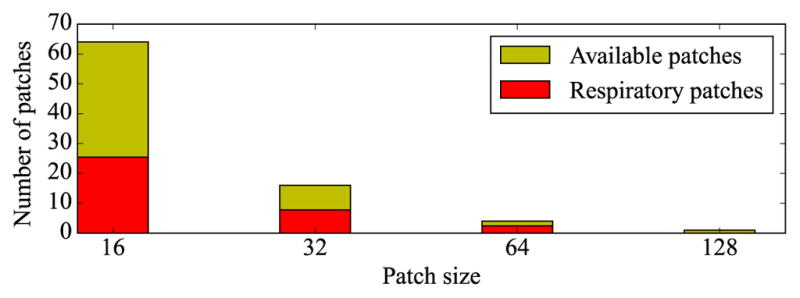
Average number of patches used in the respiratory cluster for each patch size (
 ). For comparison, the total number of available patches in each image is given for each patch size (
 ). Best viewed in color.

Average number of patches used in the respiratory cluster for each patch size (
 ). For comparison, the total number of available patches in each image is given for each patch size (
 ). Best viewed in color.