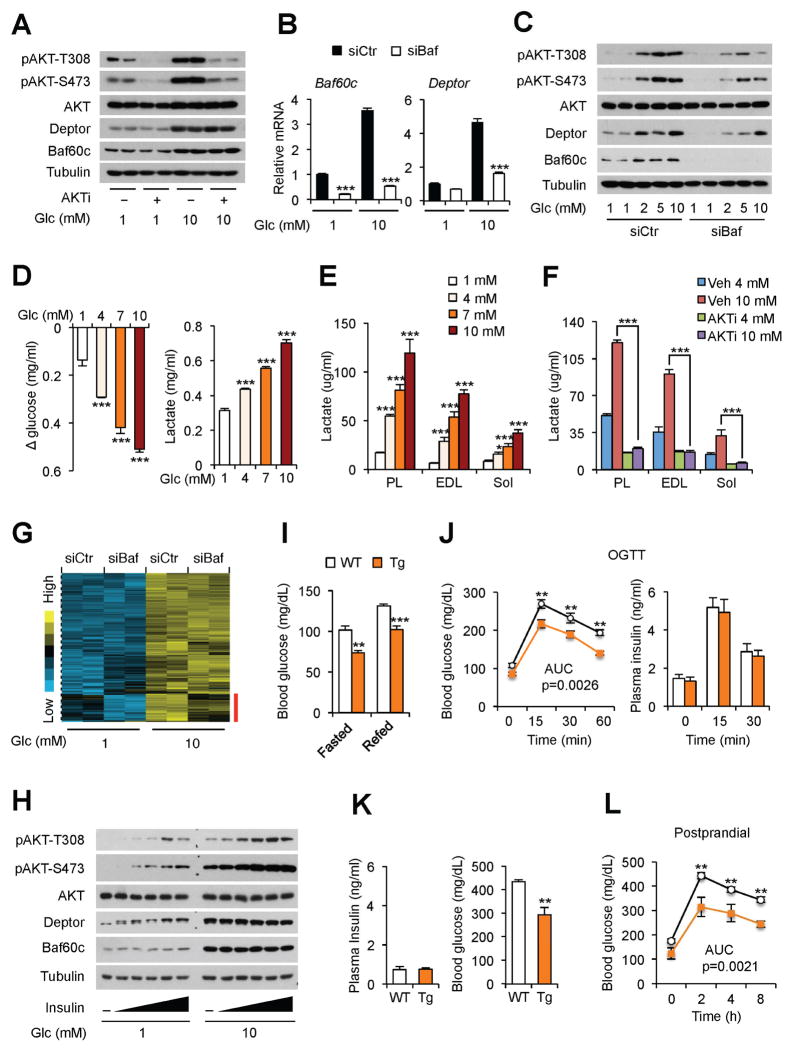
Figure 2. Baf60c-mediated glucose sensing acts in concert with insulin to facilitate postprandial glucose disposal.
(A) Immunoblots of total cell lysates from C2C12 myotubes treated with 1 mM or 10 mM glucose in the absence or presence of 10 μM AKTi for 12 h.
(B) qPCR analysis of gene expression in control (siCtr) or Baf60c knockdown (siBaf) C2C12 myotubes treated with different concentrations of glucose for 12 h. Data represent mean ± SD. ***p < 0.001 siCtr vs. siBaf; two-way ANOVA.
(C) Immunoblots of total cell lysates from control and Baf60c knockdown C2C12 myotubes treated with different concentrations of glucose for 12 h.
(D) Glucose consumption and lactate production in C2C12 myotubes pretreated with different concentrations of glucose for 12 h, followed by switching to media containing 5 mM glucose for additional 12 h. Data represent mean ± SD. ***p < 0.001 vs. 1 mM; one-way ANOVA.
(E) Lactate production in ex vivo cultured muscles after chase with media containing 5 mM glucose. Data represent mean ± SEM (n=4). *p < 0.05, ***p < 0.001 vs. 1 mM; one-way ANOVA.
(F) Lactate production in ex vivo cultured muscles in the absence or presence of AKTi (10 μM). Data represent mean ± SEM (n=4). ***p < 0.001; two-way ANOVA.
(G) Clustering analysis of glucose-responsive genes in C2C12 myotubes. The red bar indicates a cluster of Baf60c-dependent glucose-responsive genes.
(H) Immunoblots of total cell lysates from C2C12 myotubes pretreated with 1 mM or 10 mM glucose for 12 h, followed by treatment with different concentrations of insulin for 30 min.
(I) Blood glucose levels in HFD-fed WT and Tg mice. Data represent mean ± SEM (n=5–7). **p < 0.01, ***p < 0.001; two-tailed unpaired Student’s t-test.
(J) Blood glucose and plasma insulin levels during OGTT. Data represent mean ± SEM (n=5–7). **p < 0.01; two-way ANOVA with multiple comparisons. Area under curve (AUC) was evaluated by two-tailed unpaired Student’s t-test.
(K) Blood glucose and plasma insulin levels in STZ-treated HFD-fed WT and Tg mice. Data represent mean ± SEM (n=5–7). **p < 0.01; two-tailed unpaired Student’s t-test.
(L) Postprandial blood glucose levels in mice as described in (K). Data represent mean ± SEM (n=5–7). **p < 0.01; two-way ANOVA with multiple comparisons. AUC was evaluated by two-tailed unpaired Student’s t-test.
See also Figure S1.

