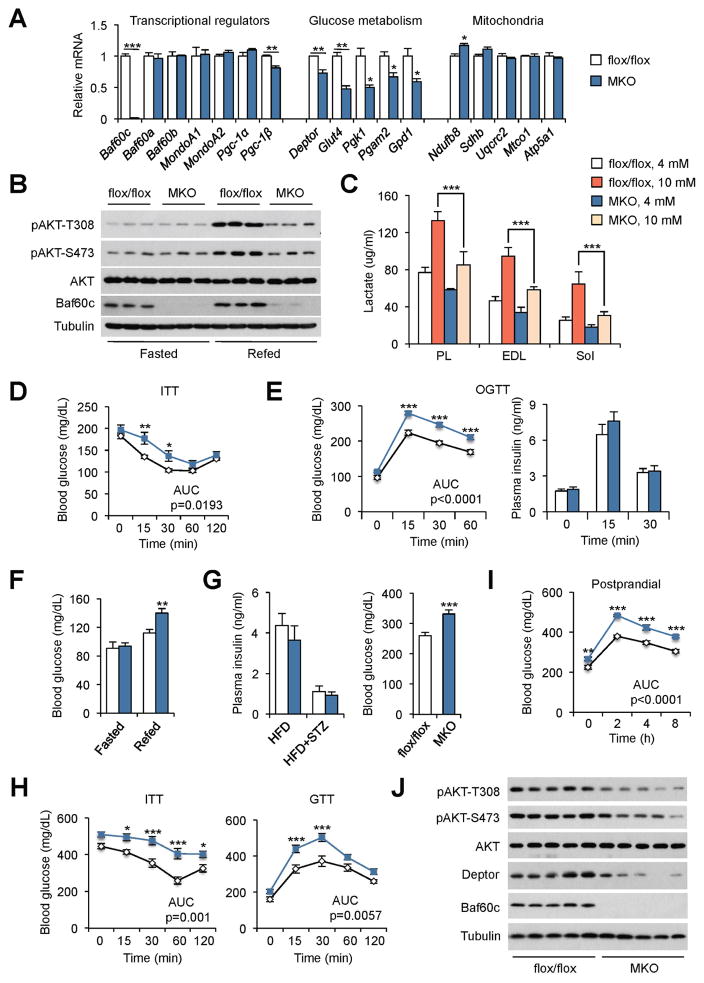
Figure 6. Skeletal muscle-specific Baf60c deficiency impairs glucose homeostasis.
(A) qPCR analysis of gene expression in EDL muscles from control (flox/flox, open) and MKO (blue) mice. Data represent mean ± SEM (n=5–7). *p < 0.05, **p < 0.01, ***p < 0.001; two-tailed unpaired Student’s t-test.
(B) Immunoblots of total protein lysates from quadriceps muscles from flox/flox and MKO mice fasted for 24 h (Fasted) or fasted for 24 h followed by refeeding for 2 h (Refed).
(C) Lactate production in ex vivo cultured plantaris (PL), EDL and soleus (Sol) muscles from flox/flox and MKO mice pretreated with 4 or 10 mM glucose for 3 h followed by 3 h chase with media containing 5 mM glucose. Data represent mean ± SEM (n=4). ***p < 0.001; two-way ANOVA.
(D–E) ITT (E) and OGTT (E) in HFD-fed flox/flox and MKO mice. Data represent mean ± SEM (n=8–11). *p < 0.05, **p < 0.01, ***p < 0.001; two-way ANOVA with multiple comparisons. AUC was evaluated by two-tailed unpaired Student’s t-test.
(F) Blood glucose levels in HFD-fed flox/flox and MKO mice fasted for 24 h followed by refeeding for 8 h. Data represent mean ± SEM (n=6–7). **p < 0.01; two-tailed unpaired Student’s t-test.
(G) Plasma insulin and blood glucose levels in STZ-treated HFD-fed flox/flox and MKO mice. Data represent mean ± SEM (n=6). ***p < 0.01; two-tailed unpaired Student’s t-test.
(H) ITT (left) and GTT (right) in mice as described in (G).
(I) Postprandial (fasted/refeeding) blood glucose levels in mice as described in (G). Data in (H–I) represent mean ± SEM (n=6). *p < 0.05, ***p < 0.001; two-way ANOVA with multiple comparisons. AUC was evaluated by two-tailed unpaired Student’s t-test.
(J) Immunoblots of total protein lysates from quadriceps muscles from STZ-treated HFD-fed flox/flox and MKO mice fasted for 24 h followed by refeeding for 2 h.
See also Figure S6.

