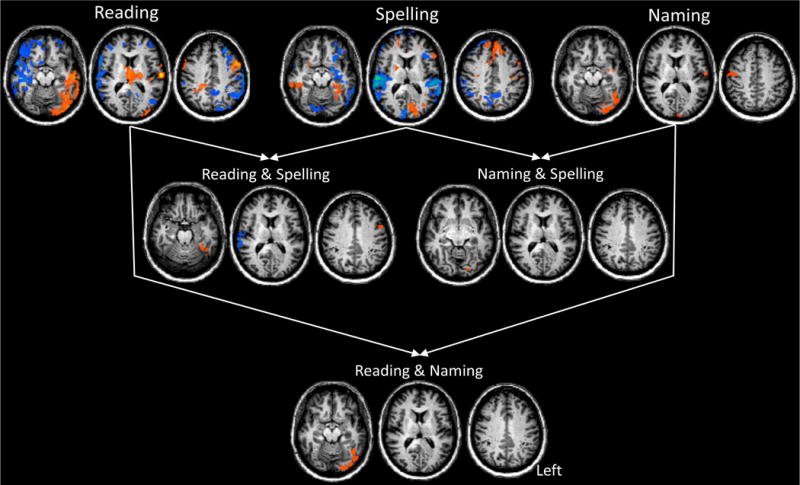
Figure 3.

Longitudinal Analysis Results comparing the T4 (1 year) to the T1 (acute) time point for Reading, Spelling, and Naming. Each row depicts axial slices (z slices = −20; 10; 35). Blue clusters depict down regulation and orange depict up-regulation of activity from the T1 to T4 time point. The top row is the T4–T1 contrast for each of the Reading, Spelling, and Naming paradigms separately. The second row presents the conjunction of T4–T1 contrasts for Reading & Spelling (left) and Naming & Spelling (right). The bottom row shows the conjunction of T4–T1 contrasts for Reading & Naming. All data was cluster level corrected at a p < 0.05.
