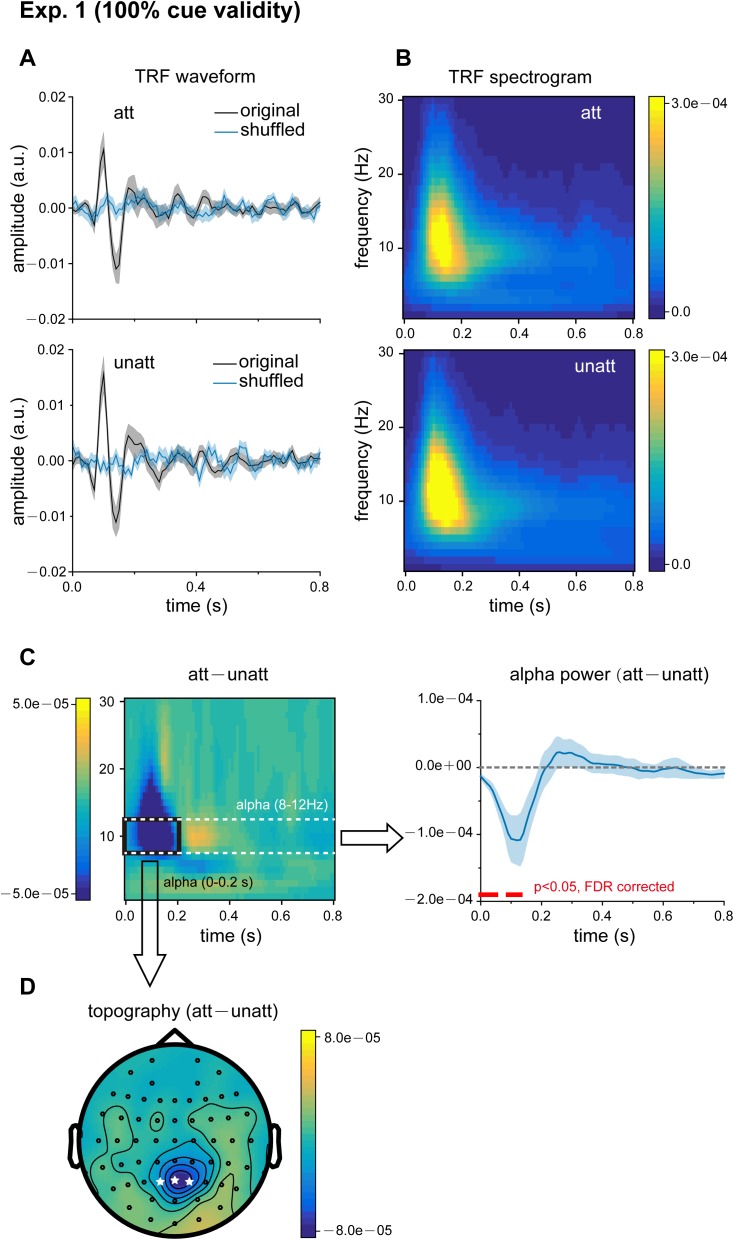
Fig 2. Results for Experiment 1 (100% cue validity): attentional alpha inhibition in temporal response functions (TRFs).
(A) Grand average (N = 18) TRF waveforms for attended (top panel, black lines, mean ± SEM) and unattended (bottom panel, black lines, mean ± SEM) visual sequences as a function of latency (0–0.8 s), representing brain responses to each unit increase in luminance in the visual stimulus sequence. Blue lines represent the TRFs obtained after the stimulus sequences and electroencephalography (EEG) responses were shuffled. (B) Grand average (N = 18) time–frequency power profile for attended (att; top) and unattended (unatt; bottom) TRFs as a function of latency (0–0.8 s) and frequency (0–30 Hz). (C) Left: grand average (N = 18) time–frequency plots for att − unatt TRF power difference. Right: grand average (blue lines, mean ± SEM) time course for att − unatt TRF power within the alpha band (8–12 Hz). Red horizontal lines at the bottom indicate points showing significant power differences in the alpha-band between att and unatt (p < 0.05, two-tailed, false discovery rate [FDR] corrected). (D) Grand average distribution map for initial 200 ms alpha-band inhibition (mean alpha-band att − unatt TRF power difference within the first 200 ms, black box in Fig 2C). White stars indicate channels with the strongest attentional alpha inhibition effects. The data are provided in the Supporting Information (see S1 Data).

