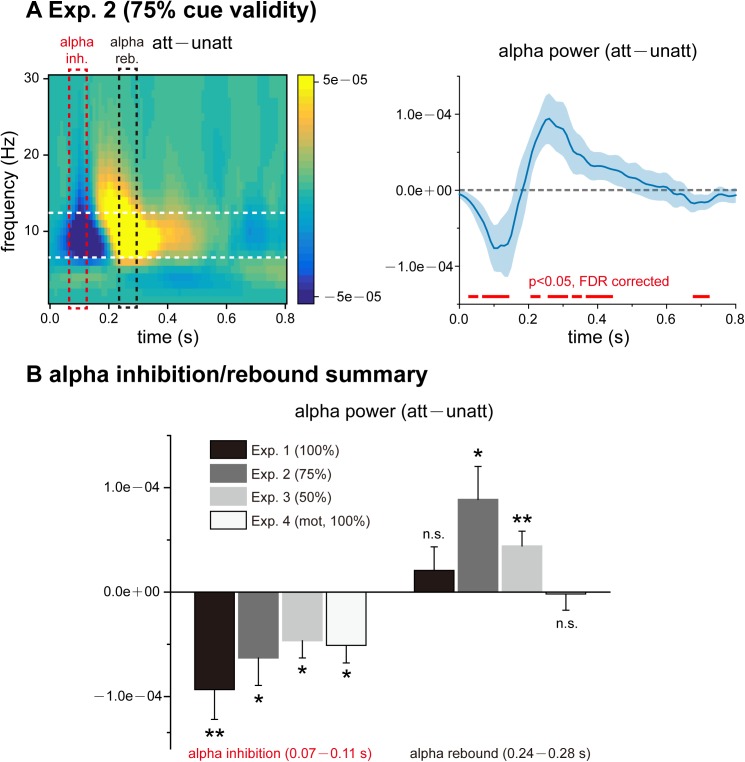
Fig 3. Results for Experiment 2 (75% cue validity) and summary of alpha inhibition and alpha rebound.
(A) Temporal response function (TRF) results for Experiment 2 (75% cue validity). Left: grand average (N = 20) time–frequency plots for att–unatt TRF power difference. Right: grand average (blue lines, N = 20, mean ± SEM) time course for att–unatt TRF power within the alpha band (8–12 Hz). Red horizontal lines at the bottom indicate points showing a significant power difference in the alpha band between att and unatt (p < 0.05, two-tailed, false discovery rate [FDR] corrected). Note the emergence of alpha-band rebound right after the alpha-band inhibition, suggesting attentional switching. (B) Grand average att–unatt TRF alpha-band power averaged over an early (alpha inhibition, 0.07–0.11 s, red dotted box in Fig 3A) and a subsequent late (alpha rebound, 0.24–0.28 s, black dotted box in Fig 3A) time range for each experiment. Experiment 1: N = 18; Experiment 2: N = 20; Experiment 3: N = 16; Experiment 4: N = 11. * p < 0.05, ** p < 0.01, t test. MOT: multiple object tracking. The data are provided in the Supporting Information (see S2 Data).

