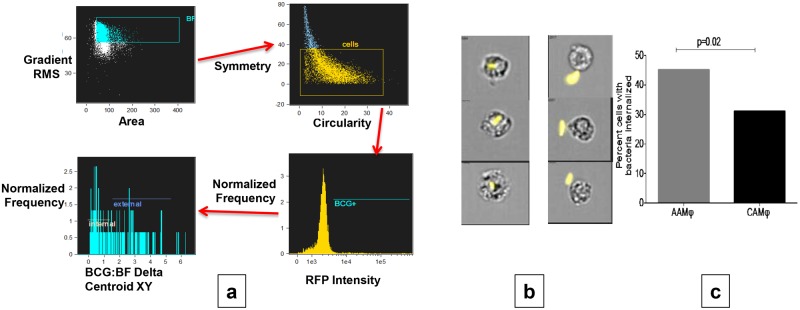
Fig 2. AAMs show increased BCG uptake compared to CAMs using ImageStreamX.
Panel a shows sequential gating strategy for assessing bacterial internalization within the cell. Cells that were in the field of focus were defined using Gradient RMS vs. Area features; next, plotting symmetry vs. circularity distinguished macrophages from free bacteria. Gating was then performed on RFP positive cells to identify macrophages associated with bacteria. Delta Centroid feature was used to assess the distance between the center of the cell and the RFP labeled bacteria to assess internalization. Panel b: representative images showing reproducibility and accuracy of internalization assessment using the above gating strategy. Three different examples of RFP labeled bacteria internalized (left panel) within macrophages vs. remaining external (right panel) are shown. Panel c: Graph comparing median percentage of cells internalizing bacteria (for n = 12 donors) using above strategy in AAMs (grey column) vs. CAMs (black column).

