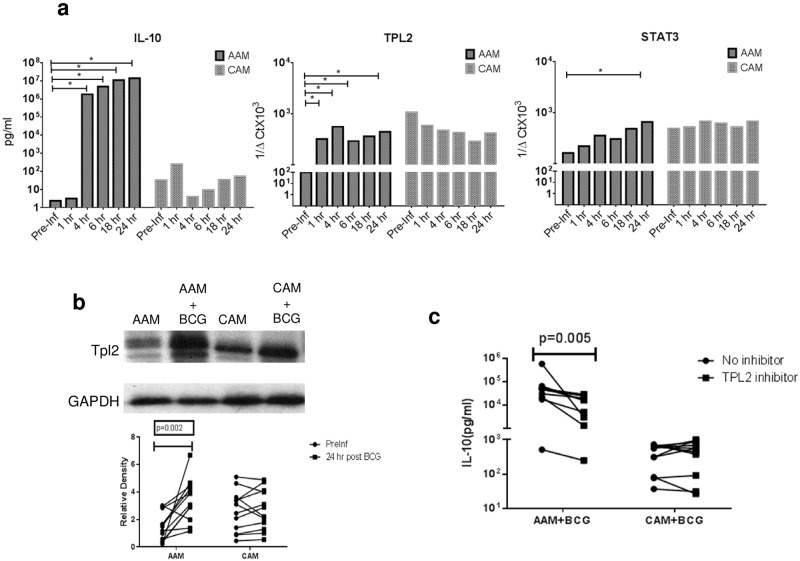
Fig 4. Increased IL-10 production in AAMs but not CAMs in is mediated by TPL-2.
Panel a: Left panel (top and bottom) shows kinetics of net IL-10 production in AAMs and CAMs (in pg/ml) starting from pre BCG infection time point (pre-Inf) to 1, 4,6,18 and 24 hrs. post BCG infection. Middle panel shows relative mRNA expression of TPL-2 at the same time points, expressed as 1/ΔCt in AAMs and CAMs. Right panel shows relative mRNA expression of STAT3, expressed as 1/ΔCt in AAMs and CAMs. Vertical bars represent median relative expression Panel b: Whole cell extracts of AAMs and CAMs, generated at pre BCG infection and at 24hrs post infection were analyzed by immunoblotting with anti-TPL-2 antibodies utilizing anti-GAPDH as control (top panel). Bottom pane shows change in relative TPL-2 band density in AAMs vs. CAMs as assessed by ImageJ software comparing pre BCG infection time point (Preinf) with 24 hrs. post BCG infection (24hr). Panel c: Net IL-10 production (in pg/ml) is shown in AAMs and CAMs cultured with BCG alone for 24 hrs. or BCG and TPL-2 inhibitor (C21H14ClFN6) at 500nM (IC50). Individual dots representing each subject. A total of 12 subjects were analyzed for experiments in 4a, b and c.

