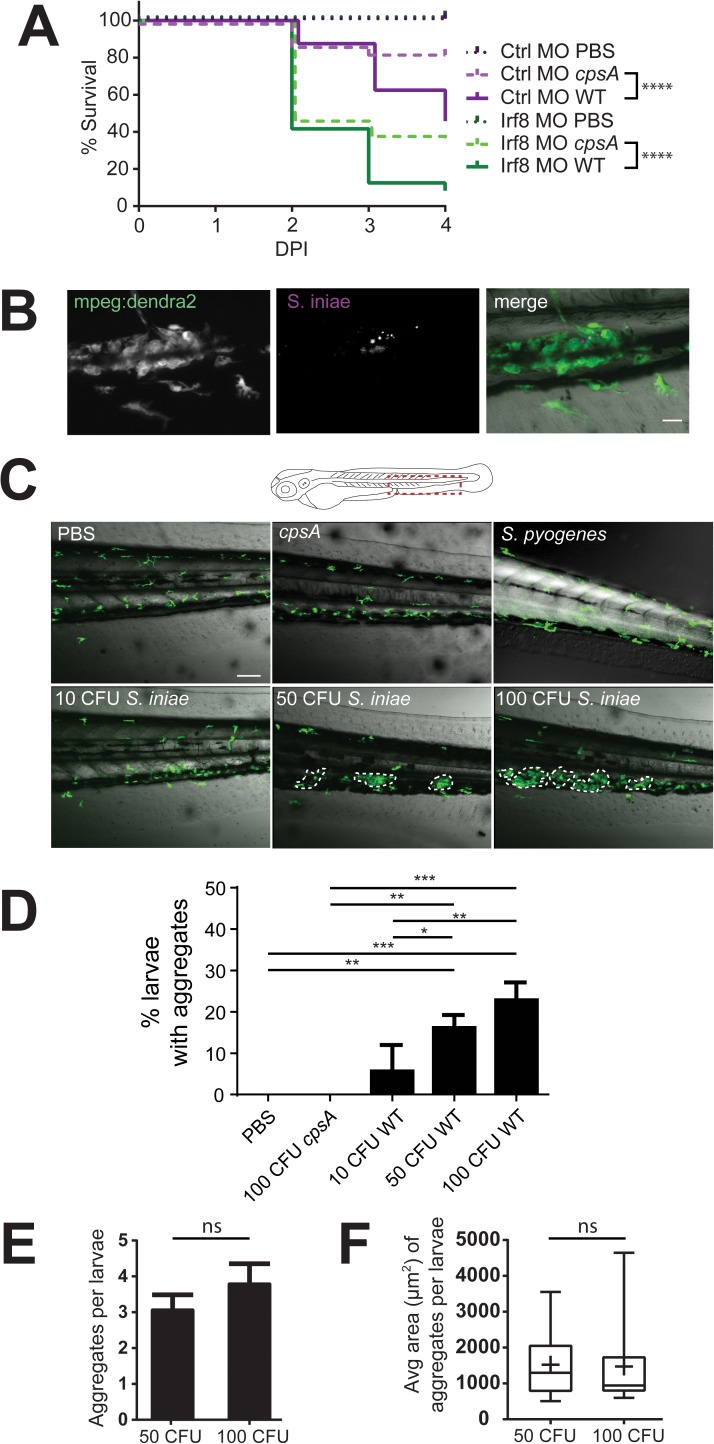
Fig 1. Macrophages are important for host defense and form aggregates in response to S. iniae infection.
(A) Survival of Tg(mpeg1:dendra2) embryos injected at the single-cell stage with either the Irf8 (Irf8 MO) or standard control MO (Ctrl MO) following mock-infection with PBS or infection with 50 CFU S. iniae. Irf8 morphants infected with both WT and cpsA S. iniae have impaired survival (p < 0.0001), compared to control morphants. (B) S. iniae labelled with Cell Tracker Red are found within macrophage aggregates. Scale bar is 20μm. (C) S. iniae infection results in the development of macrophage aggregates in the trunk/tail of a proportion of infected fish by 24 hpi (diagram, red box). Representative 20X images of macrophage aggregates in Tg(mpeg1:dendra2) larvae 24 hpi following infection with PBS, cpsA mutant, 10 CFU, 50 CFU, and 100 CFU WT S. iniae as indicated. Scale bar is 80 μm. (D) Quantification of the average total percent of larvae forming macrophage aggregates from (C). (E) Average number of aggregates per larvae and (F) average aggregate size, as measured by the peripheral area of aggregates, at 24 hpi following infection with 50 or 100 CFU WT S. iniae. Area and number were not statistically significant across conditions. Data are from at least 3 independent experiments, with 24 larvae per condition.

