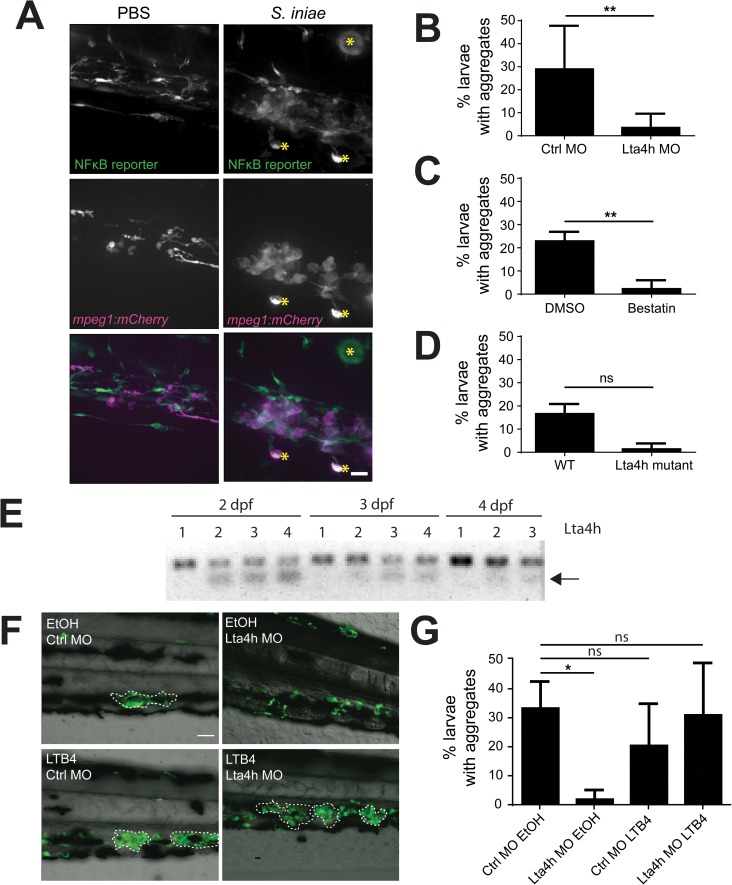
Fig 3. Disruption of Lta4h signaling abrogates macrophage aggregation.
(A) NFκB reporter expression in Tg(mpeg1:mCherry) larvae at 24hpi following inoculation with PBS or 50 CFU S. iniae. Aggregate macrophages and adjacent cells show NFκB expression. Images at 40X; scale bar is 20 μm. Non-specific signal is indicated by yellow asterisks. (B and C) Average percentage of total larvae with macrophage aggregates at 24 hpi following inoculation with 50 CFU WT S. iniae. Aggregates fail to form in (B) Lta4h knockdown, p = 0.0087, average of 6 independent experiments; during (C) Lta4h inhibition with 100 μM Bestatin, p = 0.0022, average of 6 independent experiments; as opposed to relevant controls (Control MO, 0.1% DMSO, respectively), and were decreased in an (D) Lta4h mutant, p = 0.1000, average of 3 independent experiments. (E) RT-PCR of lta4h from mRNA extracted from 2–4 dpf zebrafish. The arrow denotes the presence of an alternative transcript in larvae injected with a splice-blocking Lta4h morpholino. Lane 1 = Ctrl MO, 2 = 100 μM Lta4h MO, 3 = 200 μM Lta4h MO, 4 = 500 μM Lta4h MO. (F) Representative 20X images of exogenous addition of LTB4 rescuing aggregate formation in Lta4h morphants. Larvae were treated with 30 nM LTB4 or 0.1% ethanol (EtOH). Scale bar is 80 μm. (G) Quantification of the average total percent of larvae forming macrophage aggregates from (F).

