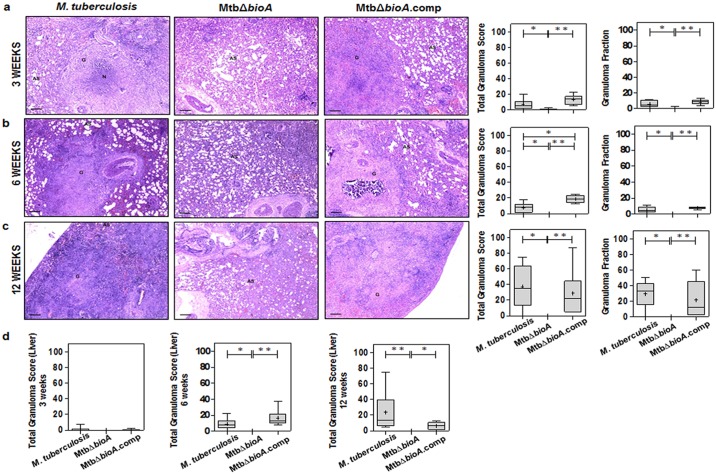
Fig 3. Histopathology of guinea pig tissues post aerosol infection with M. tuberculosis, MtbΔbioA or MtbΔbioA.comp strains.
The figure depicts representative 40x magnification photomicrographs of formalin fixed, paraffin embedded and haematoxylin-eosin (H&E) stained 5 μm sections of lung tissue of guinea pigs aerogenically infected with M. tuberculosis, MtbΔbioA or MtbΔbioA.comp and euthanized at (a) 3 weeks, (b) 6 weeks and (c) 12 weeks post infection. AS, G and N denote alveolar spaces, granuloma and necrosis, respectively. The graphical representation of the total granuloma score and granuloma fraction are shown alongside by box plot of all six animals per group (the mean is represented by ‘+’, median value is denoted by horizontal line, box represents the inter quartile range and the minimum and maximum value is denoted by whiskers). (d) Total granuloma score for liver sections of infected animals (n = 6 animals per group) at 3, 6 and 12 weeks post infection. MtbΔbioA infected animals showed negligible pulmonary as well as hepatic granulomatous pathological damage. M. tuberculosis and MtbΔbioA.comp infected animals displayed increasing number of granulomas in the lungs as well as liver. The scale bars depict 200 μm. *p <0.05 and **p <0.01 (Mann-Whitney test, two-tailed).

