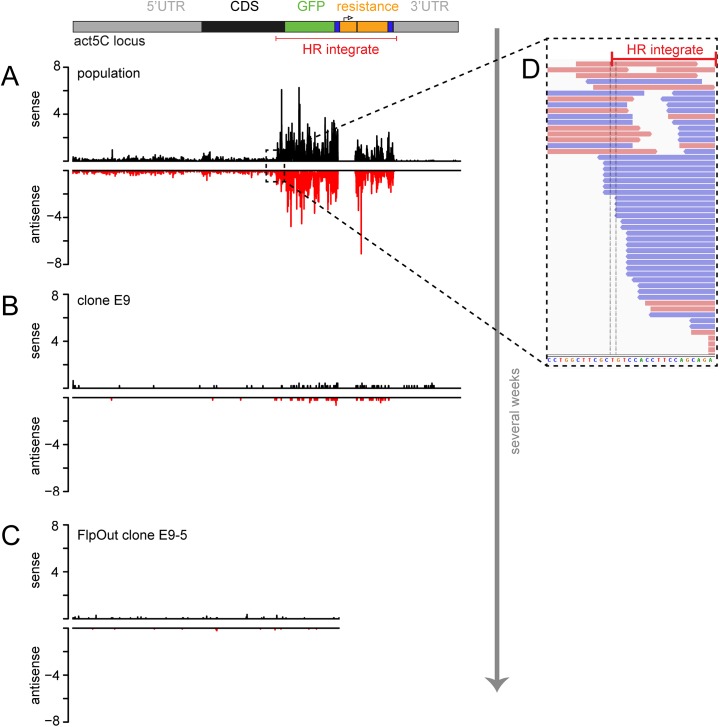
Fig 2. Profiling of siRNAs after genome editing by deep sequencing at the act5C locus.
The siRNA distribution along the modified act5C locus was determined bat single nucleotide resolution and normalized to the number of genome-matching reads in each library. The graphs depict the sense (black) and antisense (red) matching reads as reads per million of genome matching 19–25 nt reads in the respective library. Shown are the sequencing traces for the initial drug-selected population (A), the single cell clone E9 (B) and the respective FlpOut clone E9-5 (C) as representive examples. The functional regions of the locus (drawn to scale) are depicted at the top; the HR donor is annotated in red. Reads derived from the copia promotor sequence were removed prior to mapping the remaining reads on the construct. Thus, the corresponding region is “masked”. The box (D) shows the magnification of the transition between the endogenous sequence and the HR integrate (annotated red bar). Junction-spanning siRNA reads in sense (red) and antisense (blue) orientation can be detected.

