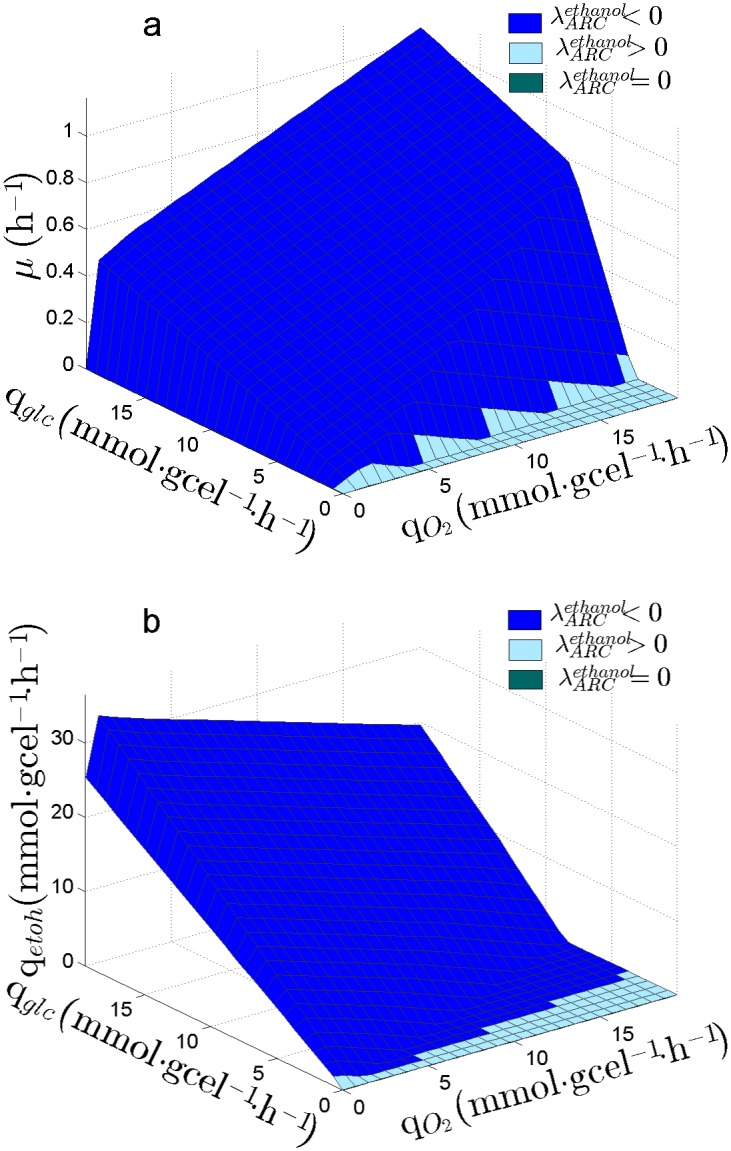
Fig 3. Sensitivity of ethanol production on the PhPP of S. cerevisiae.

: Sensitivity of qetoh to the Available Reducing Capacity (ARC). Planes are colored according to value, indicating if ARC is limiting (), is in excess () or it has no effect on qetoh. (a) showing the PhPP for specific growth rate (μ). (b) showing PhPP for specific ethanol productivity (qetoh).
