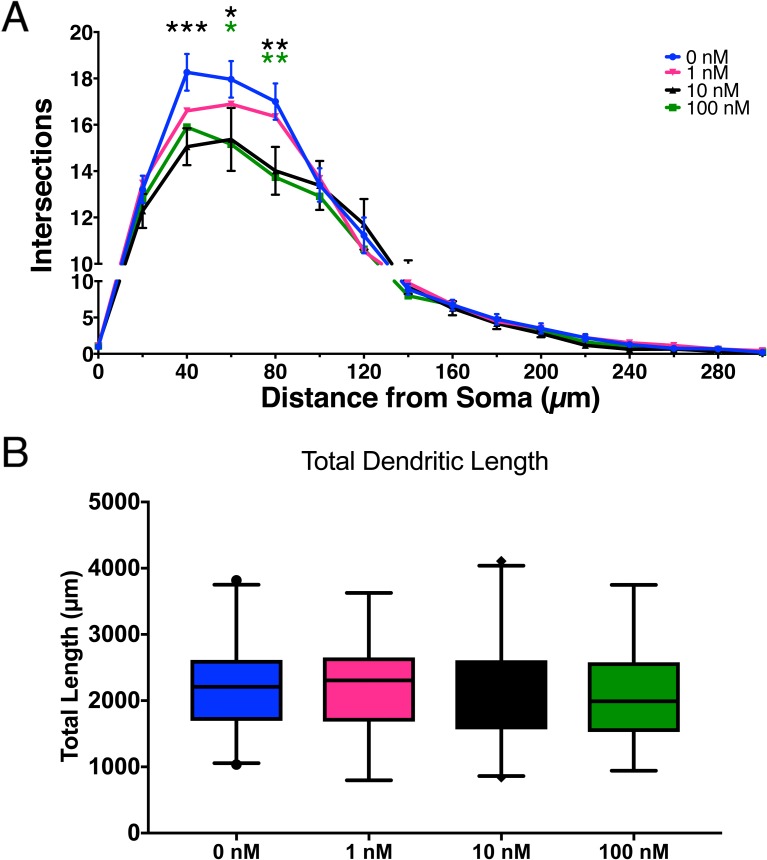
Fig 3. CRH exposure of developing cortical neurons influences dendritic branching, but not total dendritic length.
A) Sholl analysis reveals the dose-dependent effects comparing varying levels of CRH. Significant decreases were found at 40 μm from the soma (10 nM, p = 0. 0006), 60 μm (10 nM, p = 0.009; 100 nM p = 0.014), and 80 μm (10 nM, p = 0.0017, 100 nM, p = 0025). Error bars represent SEM. B) Total combined dendritic length was not different between groups. (Error bars represent SEM. B) Total combined dendritic length was not different between groups Error bars represent 2.5–97.5 percentiles on box and whisker plots. For both figures, 0.01 nM and 0.1 nM had no significant effects and are not shown.

