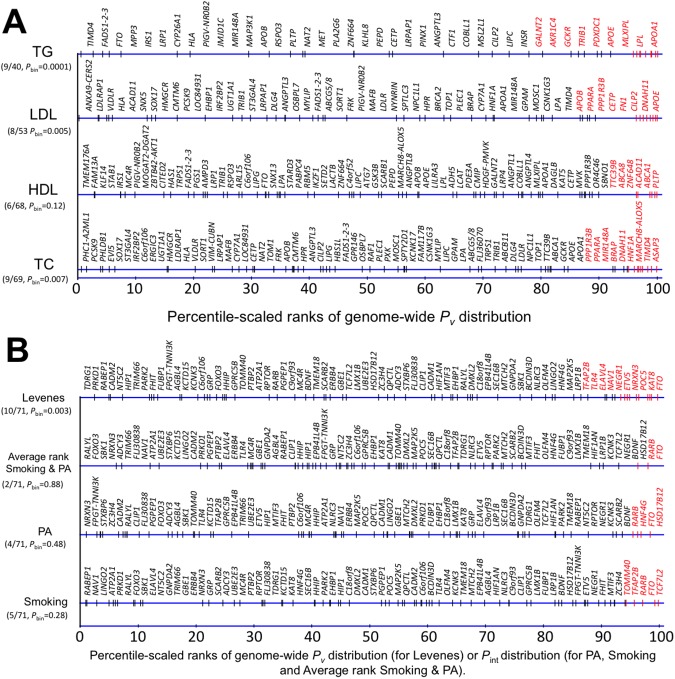
Fig 1.
A. Percentile-scaled ranks of GWAS-derived SNPs for lipid traits on the genome-wide distribution of P-values from Levene’s meta-analysis. For each lipid trait (HDL-C, LDL-C, TG and TC on the vertical axis) we ranked Pv from Levene’s test for all SNPs from lowest to highest so that the lowest Pv for a given trait was assigned a rank equal to 1. We scaled ranks into percentiles such that the lowest Pv corresponded to the 100th percentile. We then plotted percentile-scaled ranks of GWAS-derived loci (black sticks on the blue axis) on the distribution of percentile-scaled ranks of genome-wide Pv (blue axis) for each trait and marked in red loci with Pv<0.05. Loci names are presented above the axis for Pv distribution of a given trait and are positioned in the same order as percentile-scaled ranks of GWAS-derived loci, but are equally spaced to facilitate cross-trait comparison (loci names with Levene’s test Pv<0.05 are highlighted in red). To the left of each axis we present counts of GWAS-derived loci with Pv<0.05 and total number of GWAS-derived loci in the analysis separated by a dash, as well as the P-value for the binomial test (Pbinomial). B. Percentile-scaled ranks of GWAS-derived SNPs for BMI on the genome-wide distribution of P-values obtained from Levene’s test (Pv) and between-strata difference test P-values (Pint) from the ‘SNP × Physical Activity’ and ‘SNP × Smoking’ interaction tests for BMI. For each analysis, we ranked P-values for all SNPs from lowest to highest so that the lowest P-value for a given trait was assigned a rank equal to 1. We scaled ranks into percentiles such that the lowest P-value corresponded to the 100th percentile. We then plotted percentile-scaled ranks of GWAS-derived loci (black sticks on the blue axis) on the distribution of percentile-scaled ranks of genome-wide P-values (blue axis) from all four approaches and marked in red loci with Pv<0.05 or Pint<0.05 (or 95th percentile for average rank between SNP × PA and SNP × Smoking). Loci names are presented above the axis for the P-value distribution of a given trait and are positioned in the same order as the percentile-scaled ranks of GWAS-derived loci, but are equally spaced to facilitate cross-trait comparisons (loci names with Pv<0.05 or Pint<0.05 are highlighted in red). To the left of each axis conveying each respective P-value distribution, we present counts of GWAS-derived BMI loci with Pv<0.05 or Pint<0.05 (or 95th percentile for the average rank of the SNP × PA and SNP × Smoking interaction tests) and the total number of GWAS-derived loci in the analysis separated by a dash, as well as the P-value for the binomial test (Pbinomial).

