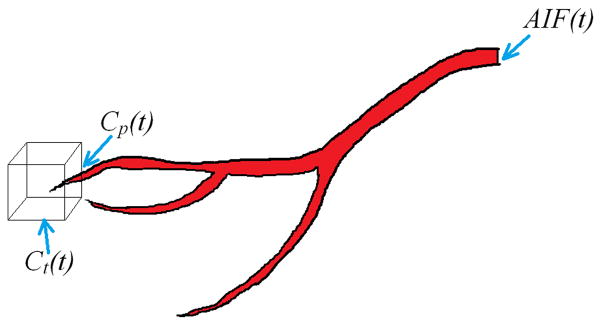
Figure 1.
Schematic diagram showing the main components of the pharmacokinetic model and their location. AIF(t) is the CA profile sampled at the location of one of the major arteries. The cube in this figure represents an imaginary voxel in the image where the tissue CA concentration profile, Ct(t), is being sampled from. Cp(t) is assumed to be the plasma CA concentration in the vessel (or vessels) feeding the tissue in the voxel.

