
Figure 4.
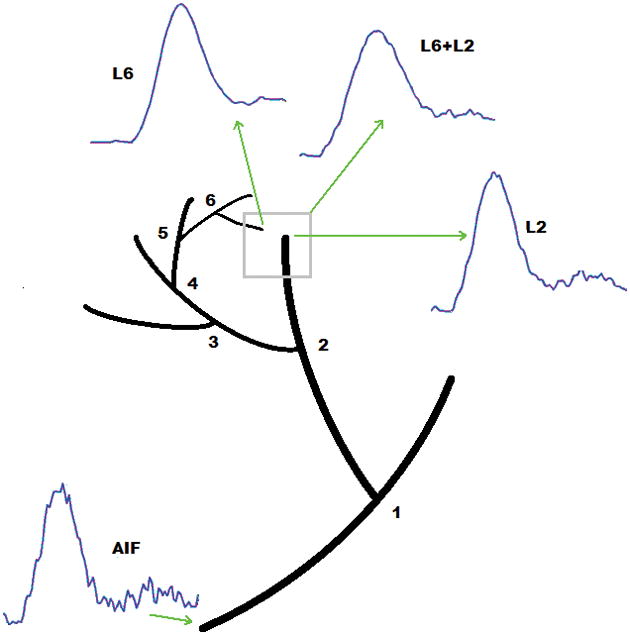
Schematic figure showing a typical AIF from one of the major cerebral arteries of a human subject in DCE-CT images and the simulated local AIFs at the second (L2) and sixth level (L6) of our vascular model. In this figure the effect of one voxel representing vessels from two different levels has been simulated. In this case the signal sampled from this voxel would be the superposition of the two signals (L6+L2). Using this configuration, we have studied the feasibility of our method to distinguish and separate the signals that form the composite signal.