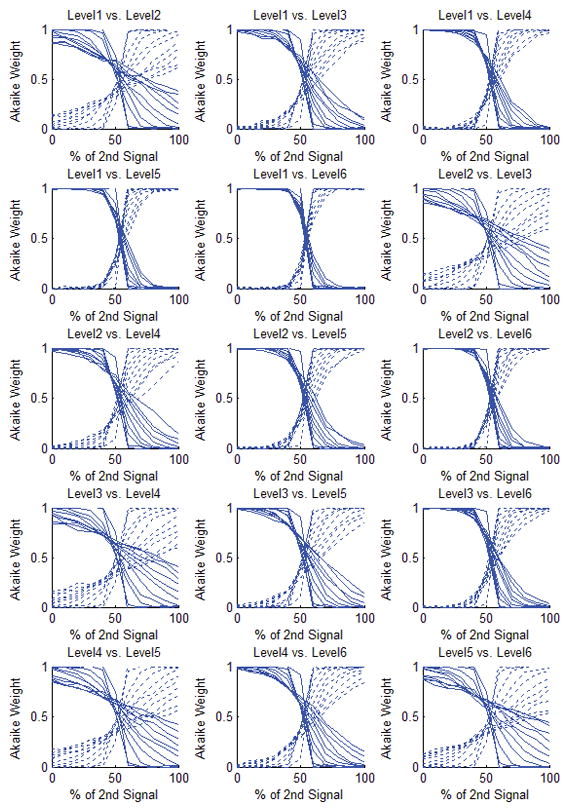
Figure 5.

Akaike weights of the simulated composite signals after decomposition. Each curve represents the average of results of 300 repetitions at each noise level. The composite signal is basically the weighted sum of the two simulated signals (the x-axis represents the percentage of contribution of the second signal in the composite signal) from different layers of the vascular structure. In each of the boxes above, each plot represents one noise level: In the upper half of the box, from left to right, each dotted line indicates 0% to 100% noise level (SNR = Inf, 100, 25, 10, 5.5, 3.6, 2.7, 1.9, 1.3, 1.1, 1) added to the composite signal and the solid lines correspond to 100% to 0% noise levels respectively. In the absence of noise, the switching point for all of these cases occurs at the 50% level which is what is expected. However, in the case that the model configuration levels are consecutive, when the noise level is increased, this switching point moves towards higher values, in favor of the model with fewer parameters. The worst case is seen in level 5 vs. level 6 when the noise level is 100%. However, even in this case even up to 52% noise level, the cutoff threshold is still around 50%.
