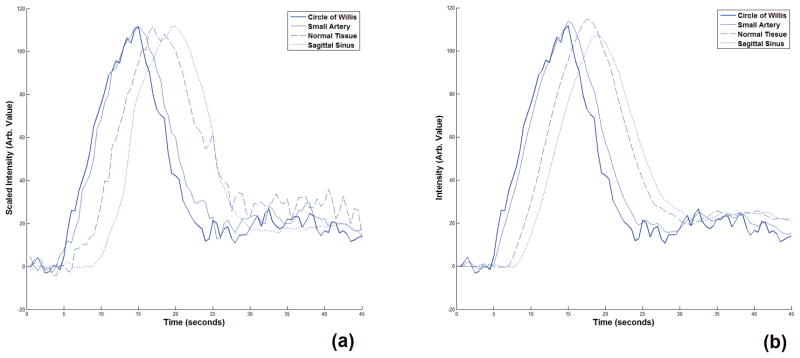
Figure 6.
(a) CA concentration signals sampled from four regions of a DCE-CT image of the human brain. These regions are the circle of Willis, a small artery which is a sub-branch of the middle cerebral artery, a region in the normal tissue and the superior sagittal sinus. These signals are scaled to show the relative dispersion and delay of the CA profiles more clearly. (b) The reconstructed CA concentration signals corresponding to the signals in (a) that were created using our proposed fitting and model selection method. As seen here, unlike the results for the other vessels, since our model was not designed for veins and venules, the reconstructed CA concentration signal representing the sagittal sinus does not match the signal sampled from this region.

