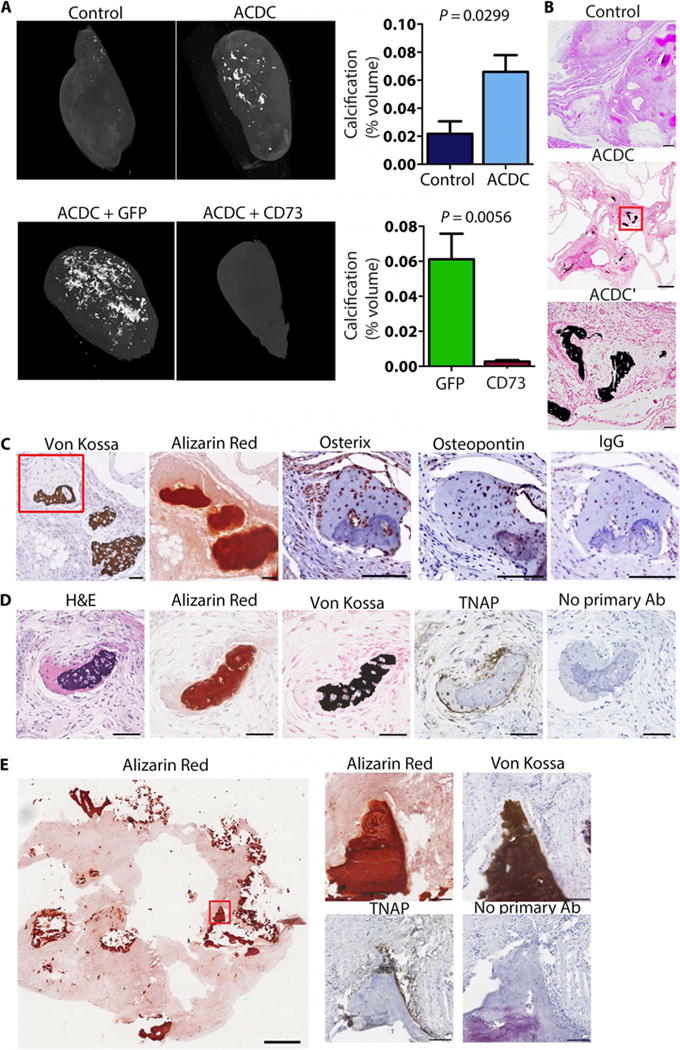
Fig. 2. ACDC iPSC teratomas exhibit extensive calcification.

(A) Representative microCT images of teratomas of control iPSCs, ACDC iPSCs, and ACDC iPSCs that overexpressed enhanced green fluorescent protein (GFP) or CD73. Data are means ± SEM of n = 11 controls from seven patient lines, n = 27 ACDC from five patient lines, and n = 6 GFP teratomas and n = 5 CD73 rescue teratomas from one patient line. P values were determined using unpaired two-tailed Student’s t test. (B) Histological analysis of teratomas with von Kossa calcium stain (dark brown). Scale bars, 250 μm (control and ACDC) and 50 μm (ACDC′). (C and D) Serial sections from ACDC iPSC teratomas demonstrating colocalization of osterix, osteopontin, and TNAP with calcification (von Kosa and Alizarin Red). The red box indicates the area shown in the osterix, osteopontin, and immunoglobulin G (IgG) images. Both IgG and no primary antibody (Ab) stainings were used as negative controls. Scale bars, 100 μm. Representative images from three teratomas are shown. H&E, hematoxylin and eosin. (E) Tissue scraped from the inner wall of the popliteal artery of an ACDC patient undergoing embolectomy and patch reconstruction showing the presence of TNAP at sites of calcification.
