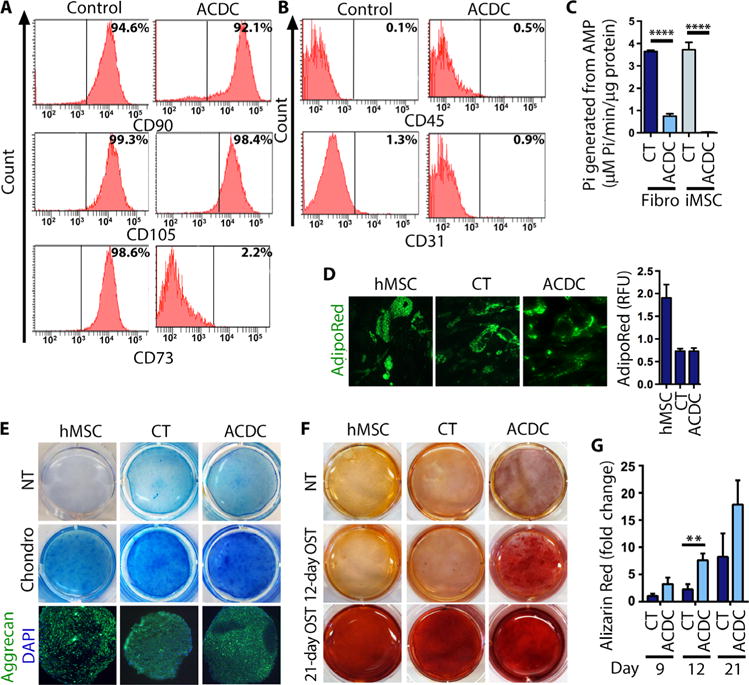
Fig. 3. Enhanced osteogenesis in ACDC iMSCs.

(A and B) Fluorescence-activated cell sorting (FACS) analysis of control and ACDC iMSCs at day 14 of differentiation detecting the MSC-specific surface markers as indicated. Representative analysis from three independent experiments is shown. (C) Production of Pi from exogenous AMP measured in control and ACDC iMSCs and parent fibroblast (Fibro) cell lines. Data are means ± SD: CT fibroblasts, CT iMSCs, and ACDC iMSCs had two cell lines; n = 6; ACDC fibroblast had four cell lines, n = 12. P value was determined using unpaired two-tailed Student’s t test. ****P < 0.0001. (D) Accumulation of lipid droplets in human MSCs (hMSCs) and CT and ACDC iMSCs after adipogenic stimulation. The bar graph shows the quantifications of intracellular lipid accumulation. Representative images are shown. Data are means ± SD, n = 5 (hMSC), n = 11 (CT), and n = 8 (ACDC). RFU, relative fluorescence units. (E) After chondrogenic (Chondro) stimulation of hMSCs, CT iMSCs, and ACDC iMSCs, cells were stained with Alcian Blue to show cartilage formation (representative images are shown). Cell pellets were cultured under the same conditions and subjected to immunostaining for aggrecan. (F) hMSCs, CT iMSCs, and ACDC iMSCs were cultured under osteogenic conditions (OST) and stained after 12 or 21 days with Alizarin Red S for calcium deposition (representative images are shown). (G) Quantification of calcification. Data are means ± SEM; day 9, n = 3 each group; day 12, n = 5 in CT and n = 6 in ACDC; day 21, n = 4 each group. **P = 0.009, unpaired two-tailed Student’s t test.
