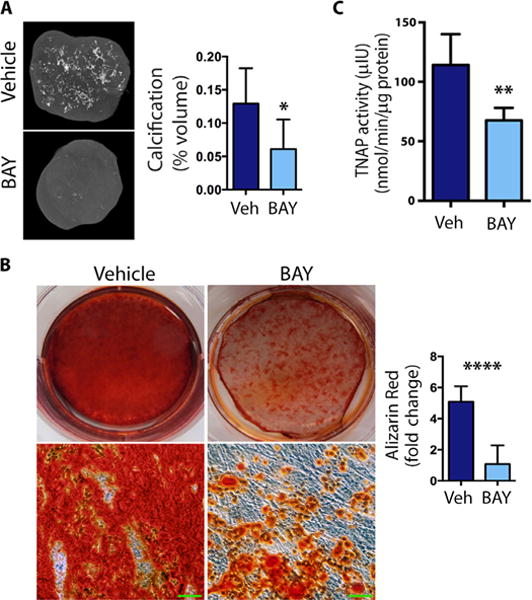
Fig. 5. A2b AR agonist inhibits calcification.

(A) The microCT analysis in ACDC teratomas with A2bAR agonist BAY 60-6583 (BAY) treatment or dimethyl sulfoxide (DMSO) (Veh) control. Calcification as a percentage of teratoma volume was assessed using CT Analyzer software. Representative images are shown. Bright spots showed dense mineralized areas. Data are means ± SEM; vehicle, n = 12 teratomas; BAY, n = 6 teratomas; *P = 0.0157, unpaired two-tailed Student’s t test. (B) Vehicle or BAY was added every other day to ACDC iMSCs under osteogenic conditions, and calcification was detected and quantified by Alizarin Red staining on day 21. Representative images are shown. The bottom images are high-magnification views of images above them. Scale bars, 100 μm. Quantification shows means ± SEM, n = 6 each group; ****P < 0.0001, unpaired two-tailed Student’s t test. (C) ACDC iMSCs were treated with osteogenic medium, and BAY or vehicle were given every other day for 9 days before TNAP activity was measured. Data are means ± SEM; n = 8 each group; **P = 0.0039, two-tailed paired Student’s t test.
