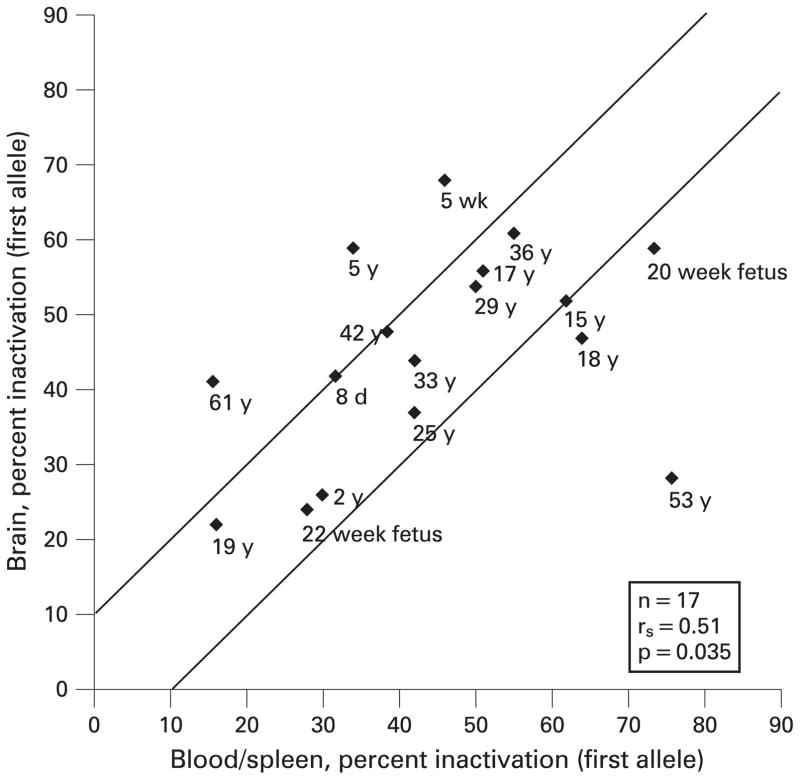
Figure 2.
Scatterplot of X-chromosome inactivation values for blood/ spleen versus brain. Lines are +/−10% variation in allele inactivation to allow for technical variation. When both blood and spleen were available from an individual, the average of the X-chromosome inactivation values was taken. w, Weeks; y, years.

