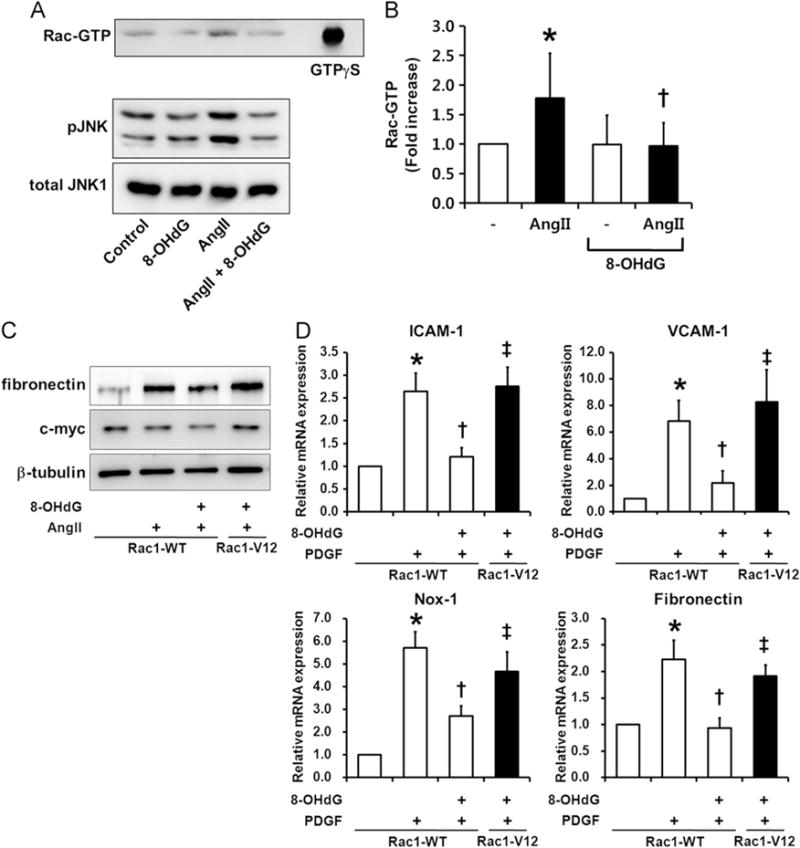
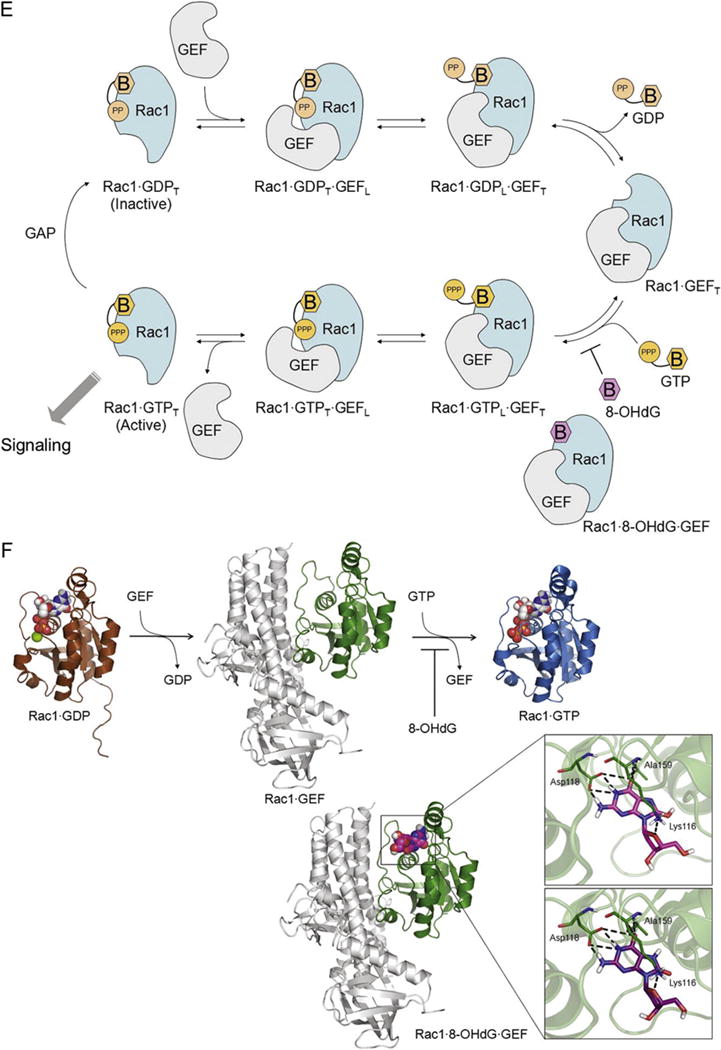
Fig. 6.


8-OHdG inhibits Rac1 activity. (A, B) Western blot analysis of Rac1-GTP and its downstream JNK phosphorylation. Values are means±SE of 3–4 experiments. *P<0.05 vs. control, †P<0.05 vs. Ang II (1 μm) treated cells. (C) Western blot analysis of VSMCs transfected with myc-tagged wild type Rac1 (Rac1-WT) or constitutively active Rac1 (Rac1-V12). Transfected cells were pretreated with 8-OHdG (100 μg/mL) for 1 h and then stimulated with Ang II (100 nM) for 24 h. Fibronectin was measured in the media collected. Anti-myc was used to monitor the transfection efficiency. (D) Real-time PCR results of ICAM-1, VCAM-1, Nox-1, and fibronectin in transfected cells. Transfected cells were pretreated with 8-OHdG (100 μg/mL) for 1 h and then stimulated with PDGF-BB (10 ng/mL) for 24 h. *P<0.05 vs. Rac1-WT, †P<0.05 vs. PDGF-BB treated Rac1-WT, ‡P<0.05 vs. PDGF-BB and 8-OHdG treated Rac1-WT. (E) Scheme for Rac1 regulation. Rac1 interacts with GDP and GTP (in orange) via their base (B) and phosphate moieties (PP for GDP and PPP for GTP). 8-OHdG (in magenta) could bind to the Rac1 GEF complex, stabilize the ternary complex of Rac1 8-OHdG GEF, and stop the activation of Rac1. The loose and tight interactions of Rac1 with the nucleotides and GEF are marked in subscript L and T, respectively. (F) Docking study showing 8-OHdG binding well at the base-binding site of Rac1 GEF, and the enlarged view of the detailed interactions. 8-OHdG and 8-oxodG are depicted in capped-stick with their carbon color in magenta and purple, respectively, and the interacting residues are in thin-stick with their carbon color in green. The hydrogen bonds are marked in black dashed lines. Rac1 structures bound with GDP(Mg), GTP(Mg), and GEF are represented in their secondary structures and colored in brown, sky-blue, and green, respectively. GEF is displayed in gray ribbons. The ligands are depicted in spacefill with their carbon color in white for GDP and GTP, and magenta for 8-OHdG. The non-polar hydrogens are undisplayed for clarity. GEF; guanosine exchange factor, GAP; GTPase-activating protein.
