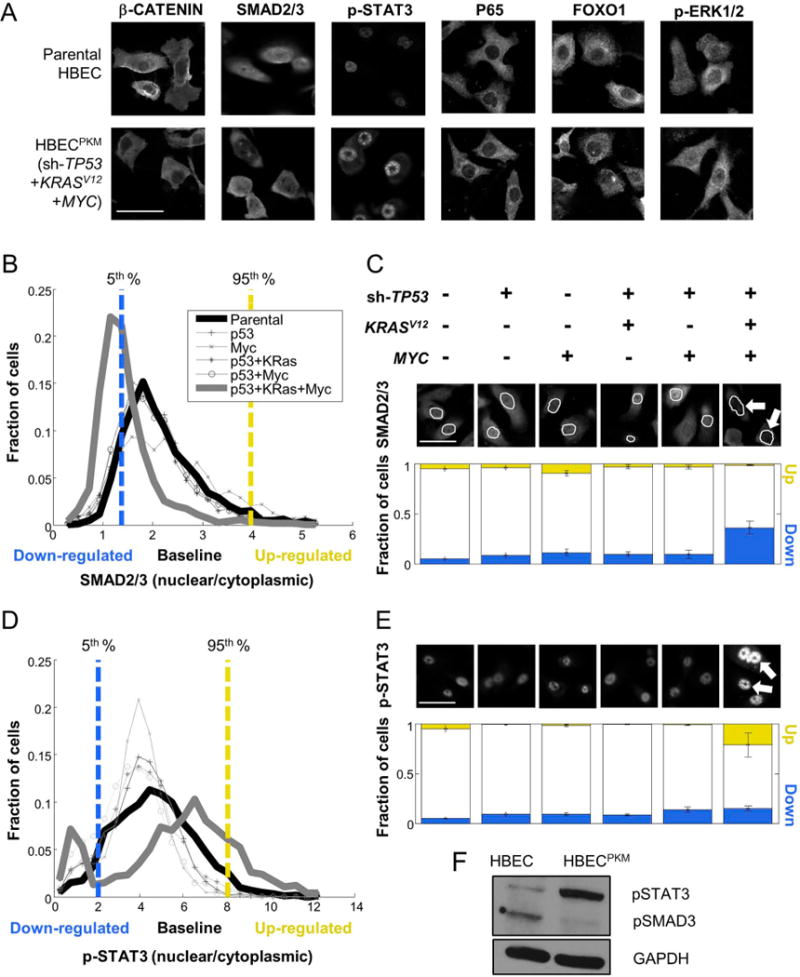
Figure 1. Oncogenically transformed HBECPKM cells reveal significant alterations in SMAD2/3 and STAT3 signaling.

A. Immunofluorescence (IF) images of parental and HBECPKM with antibodies against β-CATENIN, SMAD2/3, p-STAT3, P65, FOXO1, p-ERK1/2 (scale bar = 50 μm).
B. Definition of downregulated (blue), baseline and upregulated (yellow) fraction of cells in SMAD2/3 signaling in oncogenically manipulated HBECs compared to the parental HBEC. For each cell line, shown are the single cell distributions of nuclear to cytoplasmic SMAD2/3 intensity. The vertical lines denote 5th (blue) and 95th (yellow) percentiles of the parental HBEC distribution. Cells below and above these lines are considered down-regulated and up-regulated respectively.
C. Quantification of signaling alteration for total SMAD2/3 in parental and oncogenically manipulated HBECs. Top: Shown are the oncogenic manipulations performed on each cell line. Middle: Sample IF images with antibodies against SMAD2/3, with cell nuclei outlined in white. The white arrows point to lower SMAD2/3 in the nuclei of HBECPKM cells. Bottom: For each cell line, blue and yellow bars indicate the fraction of up-regulated (“up”) and down-regulated (“down”) cells. Error bars represent standard deviations (n = 8 technical replicates) for fractions of altered subpopulation measured across technical replicate wells.
D–E. As in (B-C) for p-STAT3 (n = 6 technical replicates). Growth conditions are as described in text.
F. Western blot for parental HBEC and HBECPKM cells with antibodies against p-SMAD3, p-STAT3 and GAPDH (loading control).
