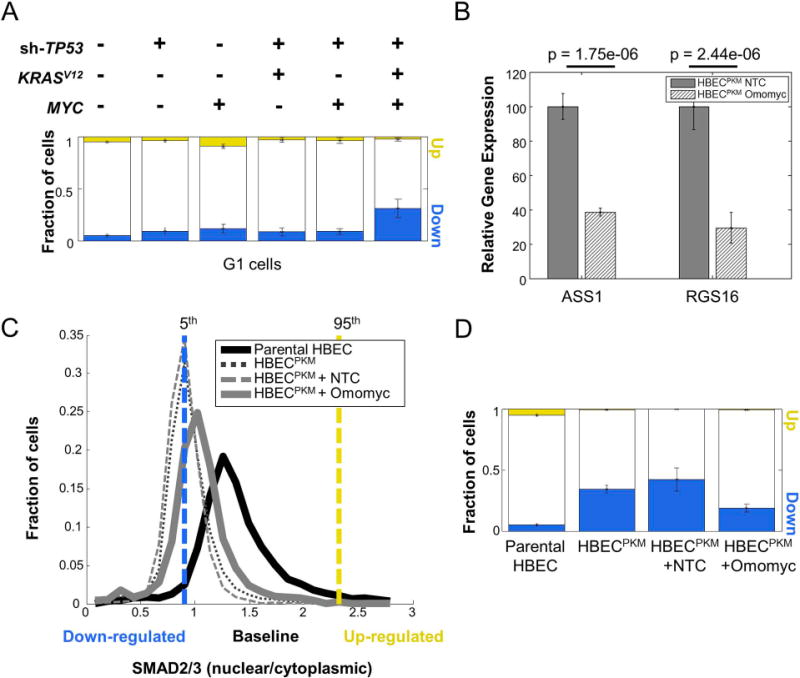
Figure 3. Down-regulation in SMAD2/3 signaling is oncogene-dependent.

A. Single-cell quantification of altered fraction of cells across parental and oncogenically manipulated HBEC cell lines in G1 phase of cell cycle. Cells were computationally classified into various cell cycle phases based on their DNA intensity (5). For each step in the oncogenic progression, only cells belonging to the G1 phase were considered. SMAD2/3 signaling alteration was calculated as in Fig. 1C (n = 8 technical replicates).
B. qRT-PCR analysis of well-known MYC target genes (ASS1, RGS16) in HBECPKM cells with Non-target control (NTC) and Omomyc construct. The expression of each gene in HBECPKM cells with Omomyc construct is normalized to its expression in HBECPKM cells with NTC. Error bars represent standard deviation (n = 6 technical replicates); p-values are computed using a two-sided t-test.
C. Effect of MYC knockdown on SMAD2/3 signaling. Shown are the single-cell distributions of SMAD2/3 signaling (as in Fig. 1B) for HBECPKM (black dotted line), HBECPKM with non-target control vector (grey dashed line), HBECPKM with Omomyc vector (solid grey line), compared to parental HBEC (solid black line). The vertical lines denote 5th (blue) and 95th (yellow) percentiles of the parental HBEC distribution. Cells below and above these lines are considered down-regulated and up-regulated respectively. Results are obtained from pooling wells (n = 6 technical replicates).
D. Quantification of SMAD2/3 signaling heterogeneity showing fraction of upregulated (yellow) and downregulated (blue) cells, in HBECPKM, with non-target control and Omomyc construct. Error bars as in Fig. 1C (n = 6 technical replicates).
