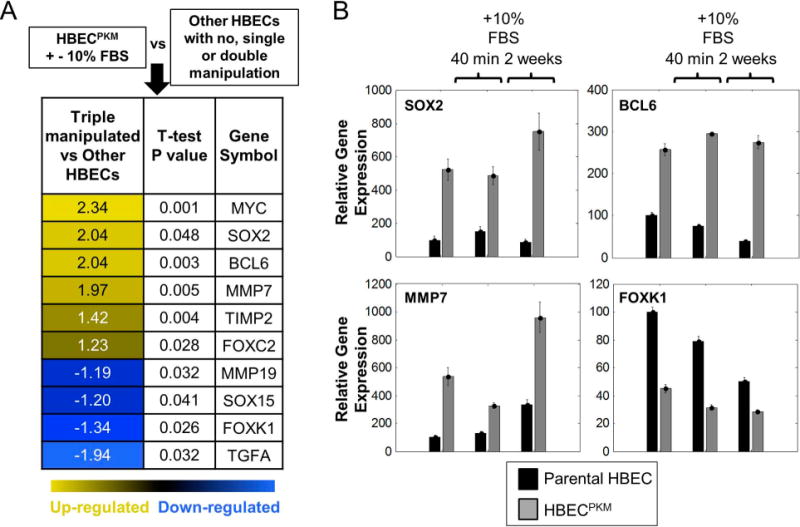
Figure 4. Alterations in SMAD2/3 downstream genes may reveal novel targetable vulnerabilities.

A. mRNA expression analysis of TGFβ downstream genes using microarray. HBECPKM cells grown in presence and absence of 10% FBS is in one group. Other HBECs (with no, single or double manipulations) are in the second group. Only differentially and significantly altered (two-sided t-test, p-value < 0.05) genes are shown. Numbers in the first column represent fold change (Log2) between the median level of gene expression of HBECPKM and other HBECs.
B. mRNA expression analysis of top 3 upregulated genes (SOX2, BCL6, MMP7) in HBECPKM cells using qRT-PCR. FOXK1 is used as an example of a downregulated gene in HBECPKM. Parental HBEC (black) or HBECPKM (grey) were grown in defined, serum-free growth condition, in 10% FBS treatment for 40 minutes or in 10% FBS treatment for 2 weeks. y-axis: gene expression relative to human reference (Methods). Error bars represent standard error (n = 6 technical replicates).
