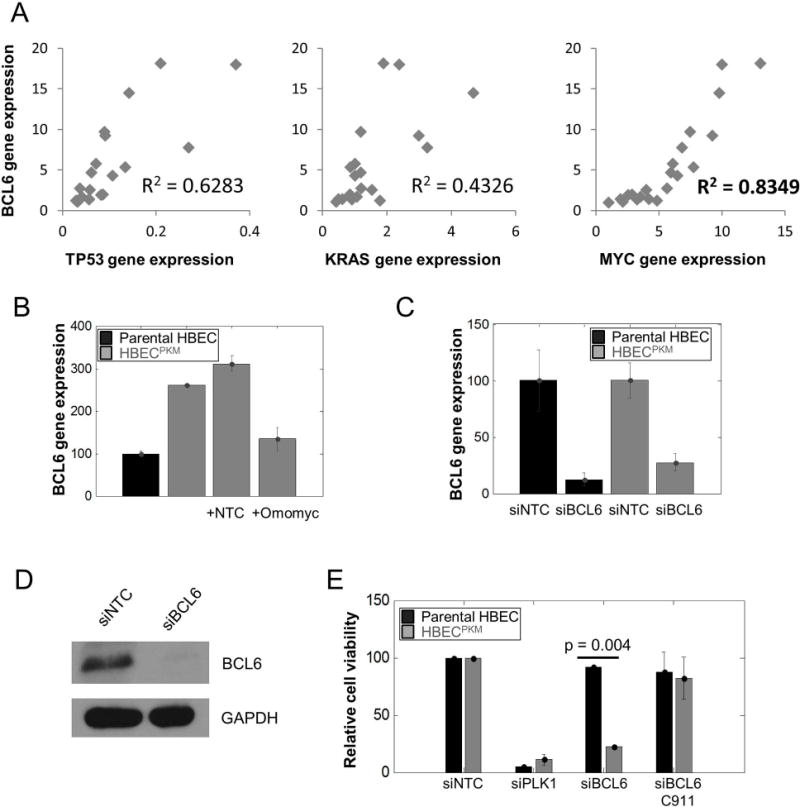
Figure 5. BCL6 is a targetable vulnerability in HBECPKM cells.

A. Correlation of relative BCL6 gene expression and TP53, K-RAS and MYC gene expression in 20 single-cell clonal populations of HBECPKM using qRT-PCR. The coefficients of determination R2 (0.6283, 0.4326 and 0.8466 respectively) for simple linear regression as shown.
B. qRT-PCR of BCL6 gene expression for (left to right): parental HBEC (black), HBECPKM, HBECPKM transfected with non-target control (NTC) and HBECPKM transfected with Omomyc construct. Error bars are as in Fig. 3B (n = 2 technical replicates); normalization is with respect to the parental HBEC.
C. Confirmation of BCL6 knockdown based on gene expression. Relative BCL6 gene expression using qRT-PCR for (left to right): parental HBEC transfected with non- target control, parental HBEC transfected with siRNA against BCL6, HBECPKM transfected with non-target control and HBECPKM transfected with siRNA against BCL6. Error bars are as in Fig. 3B (n = 6 technical replicates); the expression of BCL6 in each cell line with siBCL6 is normalized to BCL6 expression with siNTC.
D. Confirmation of BCL6 knockdown based on protein expression. Western blot showing BCL6 protein expression in HBECPKM transfected with non-target control and siRNA against BCL6
E. Effect of BCL6 knockdown on cell viability for parental HBEC and HBECPKM transfected with (left to right): non-target control, siRNA against PLK1 (positive toxic control), siRNA against BCL6, and C911 control for siBCL6. Error bars represent standard error (n = 2 technical replicates) and p-values are calculated using a two sided t-test.
