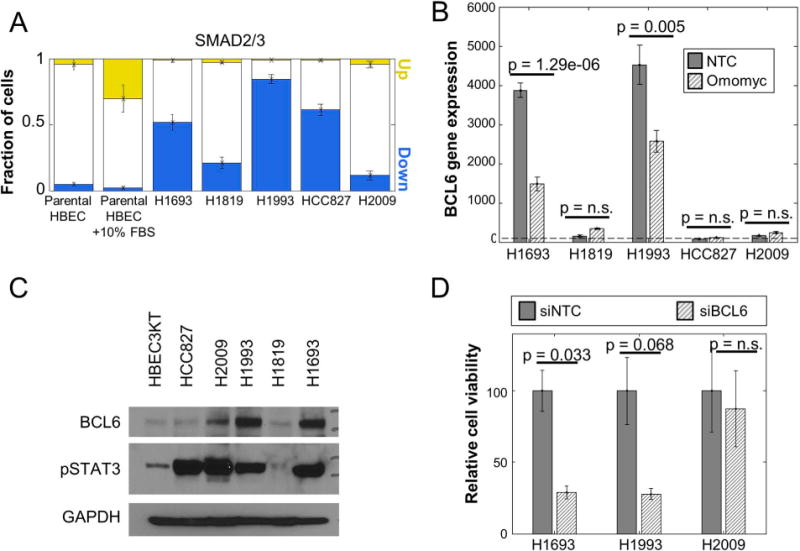
Figure 6. BCL6 in a targetable vulnerability in a subset of NSCLC cell lines.

A. Quantitation of the fraction of cells with altered SMAD2/3 signaling in NSCLC cell lines H1693, H1819, H1993, HCC827 and H2009 compared to parental HBEC and parental HBEC treated with 10% FBS for 40 minutes (positive control) based on immunofluorescence microscopy. Error bars (n = 7 technical replicates) as in Fig. 1C.
B. Relative BCL6 gene expression from qRT-PCR assay of NSCLC cell lines transfected with non-target control and Omomyc construct compared to the level in parental HBEC (horizontal dotted line). Error bars and p-values are as in Fig. 3B (n = 6 technical replicates).
C. Protein expression of BCL6 and phospho-STAT3 in NSCLC cell lines H1693, H1819, H1993, HCC827 and H2009 compared to parental HBEC as measured by western blot. GAPDH is used as a loading control.
D. Relative viability of NSCLC cell lines H1693 and H1993 compared to H2009 after siRNA mediated BCL6 knockdown. Error bars and p-values are as in Fig. 3B (n = 2 technical replicates).
