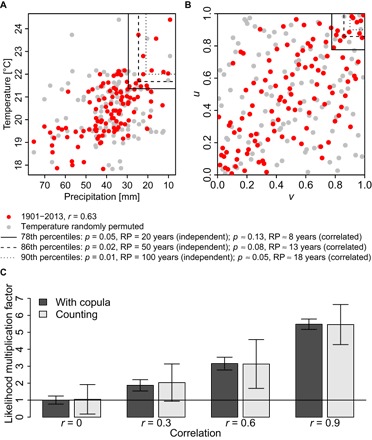
Fig. 2. Dependence affects the likelihood of bivariate extremes.

(A) Temperature and negative precipitation averaged across June, July, and August (warm season) at 56.25°E, 51.25°N in CRU for the time period 1901–2013 (red). Data where the values of temperature are randomly permutated are shown in gray. (B) Same data as in (A) transformed into normalized ranks. The regions where both variables concurrently exceed both 78th (solid), 86th (dashed), and 90th percentiles (dotted), corresponding to 20-year (p = 0.05), 50-year (p = 0.02), and 100-year (p = 0.01) bivariate return periods for independent data under the condition that temperature and negative precipitation exceed the same quantile (u = v), are depicted. Return periods of the original, correlated data based on the same thresholds correspond to approximately 8 years (p ≈ 0.13), 13 years (p ≈ 0.08), and 18 years (p ≈ 0.05). (C) Comparison between estimating changes in the likelihood of bivariate extremes by counting extremes (light bars) and modeling the extremes with copulas (dark bars) for different coefficients of correlation. The increase in likelihood due to the correlation is shown, taking an event in which both variables are independent and exceed their 90th percentile as reference (that is, a 100-year event). Whiskers represent 1 SD over 83 repetitions.
