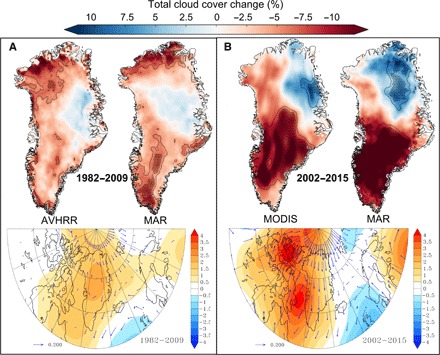
Fig. 1. Total change in summer (JJA) cloud cover from satellites and a regional climate model.

(A) Comparison between AVHRR (12) (left, top) and MAR (right, top) total JJA cloud cover change (%) during the full available data period of AVHRR between 1982 and 2009. Bottom: Trend of JJA 500-hPa geopotential height (Z500) in meters per year. The arrows show the wind trend in meters per second per year and highlight the circulation anomalies induced by the JJA Z500 changes. The arrow length of a change of 0.2 m/s per year is given in the legend for indication. (B) Comparison is the same as in (A) but for MODIS (11) (left; full observation period, 2002–2015) and MAR (right; 2002–2015). Values inside the black line have a significance level of P < 0.10, and the dotted areas indicate statistical significance at P < 0.05. All cloud cover trends are individually based on a linear regression analysis for every pixel.
