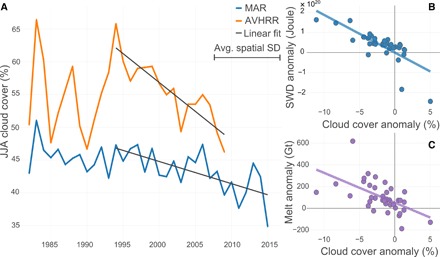
Fig. 2. Summer (JJA) cloud cover time series, trends, and impacts of clouds on melt and radiation.

(A) Time series of average Greenland cloud cover from AVHRR sensor (orange; 1982–2009) and MAR (blue; 1982–2015). Linear fit (dark gray): AVHRR (1994–2009): R2 = 0.76, P < 0.001; MAR (1994–2015): R2 = 0.46, P < 0.001. Length of one average spatial SD is shown in the legend. (B) Correlation between MAR JJA cloud cover anomalies and JJA SWD anomalies (R2 = 0.58, P < 0.001). A similar scatterplot showing the correlation between cloud cover and LWD anomalies can be found in fig. S3. (C) Correlation between JJA cloud cover anomalies and JJA melt anomalies (R2 = 0.32, P < 0.001). All anomalies in (B) and (C) are calculated on the basis of the 1970–1995 average.
