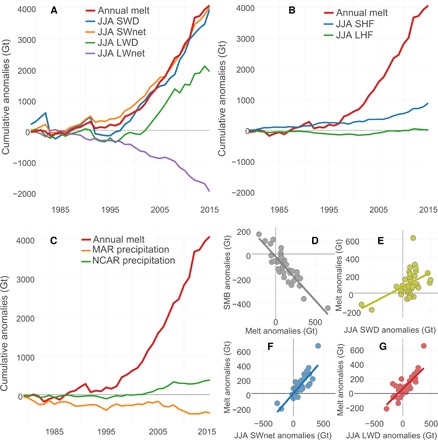
Fig. 3. Accumulated melt anomalies and contributing factors.

(A) Accumulated annual melt anomalies (in Gt) and JJA SWD, SWnet, LWD, and LWnet (net longwave radiation) anomalies. Radiation anomalies converted from joules to “melt potential” (in Gt) (see Materials and Methods). Anomalies are based on the 1970–1995 average of MAR (Eq. 2), and the accumulation of anomalies starts in 1979. (B) Description the same as in (A) but showing JJA latent heat flux (LHF) and sensible heat flux (SHF). (C) Accumulated annual precipitation anomalies (MAR and NCEP version 1 reanalysis) and annual melt anomalies. NCAR, National Center for Atmospheric Research. (D) Correlation between annual melt anomalies and annual SMB anomalies (R2 = 0.77, P < 0.001). (E) Correlation between JJA SWD anomalies and melt anomalies (R2 = 0.26, P < 0.001). (F) Correlation between JJA SWnet anomalies and melt anomalies (R2 = 0.75, P < 0.001). (G) Correlation between JJA LWD anomalies and melt anomalies (R2 = 0.63, P < 0.001).
