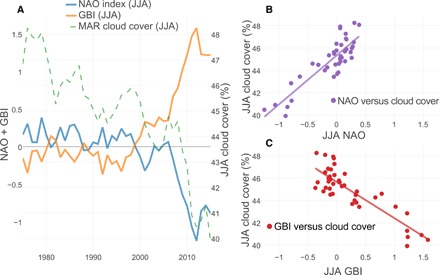
Fig. 4. Correlation between cloud cover (model) and measured NAO/GBI index during summer (JJA).

(A) Five-year running average of MAR JJA cloud cover (green; %), JJA NAO index (blue), and JJA GBI (orange). (B) The scatterplot (purple) shows the correlation (R2 = 0.75, P < 0.001) between observed NAO index and MAR cloud cover (both for JJA). (C) The scatterplot (red) shows the correlation (R2 = 0.74, P < 0.001) between GBI and MAR cloud cover (both for JJA).
