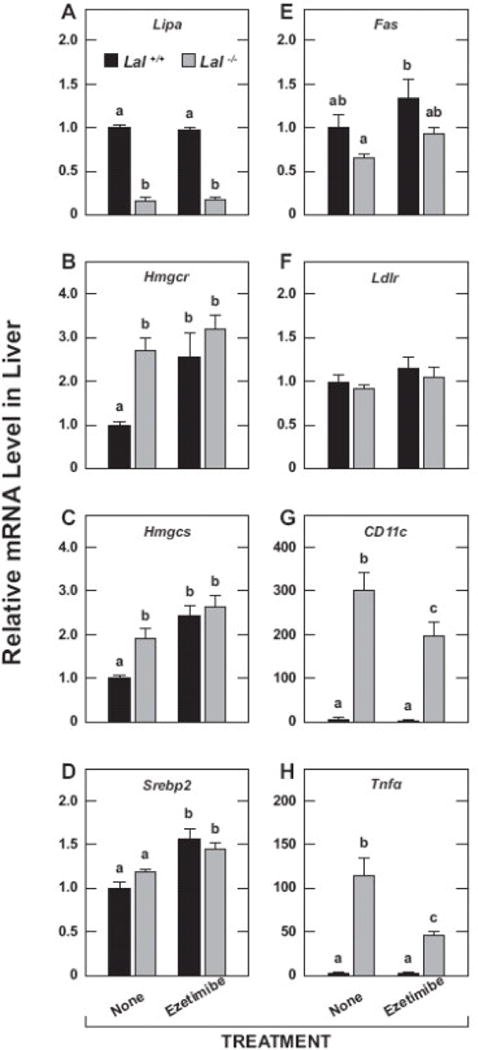
Fig. 6.

Relative expression level for various genes in the livers of Lal+/+ and Lal−/− mice given ezetimibe in their diet from 21 to 50 days of age. These analyses were performed using aliquots of the same liver taken for the measurement of esterified and unesterified cholesterol concentrations (Fig. 4A, 4B). The mRNA levels were normalized to cyclophilin, and the values for each mouse were then expressed relative to those obtained for their matching Lal+/+ controls, which, in each case, were arbitrarily set at 1.0. Values are the mean ± SEM of data from 6 mice in each group. Different letters (a-c) denote statistically significant (p<0.05) differences as determined by 2-way ANOVA with genotype and treatment as variables.
